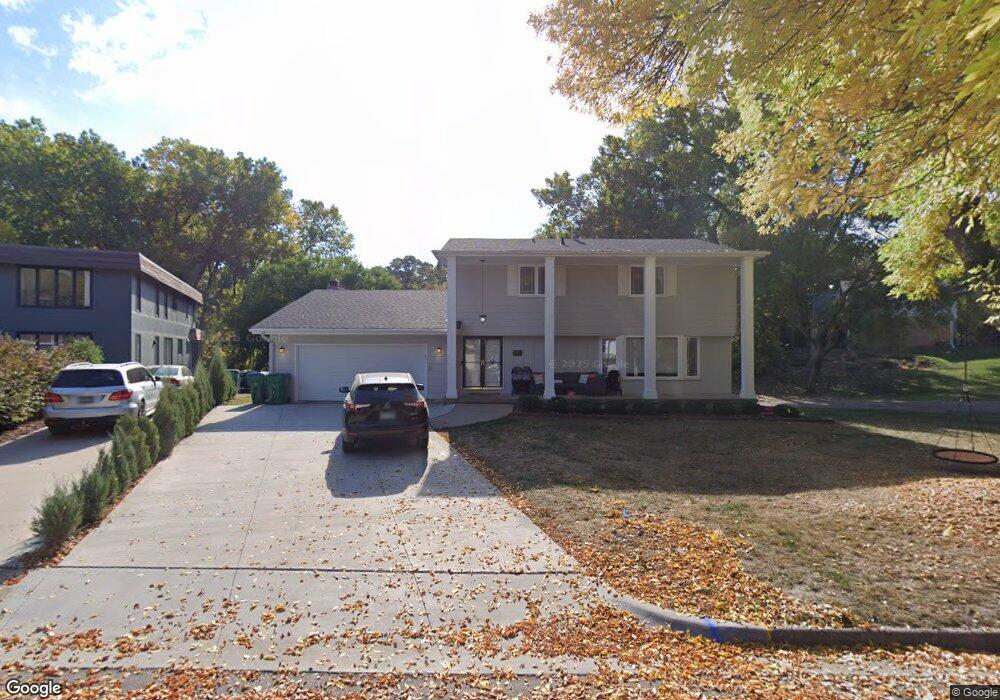
2837 Monterey Pkwy Saint Louis Park, MN 55416
Fern Hill NeighborhoodEstimated Value: $724,000 - $876,910
5
Beds
4
Baths
3,658
Sq Ft
$225/Sq Ft
Est. Value
About This Home
This home is located at 2837 Monterey Pkwy, Saint Louis Park, MN 55416 and is currently estimated at $821,228, approximately $224 per square foot. 2837 Monterey Pkwy is a home located in Hennepin County with nearby schools including Susan Lindgren Elementary School, St. Louis Park Middle School, and St. Louis Park High School.
Ownership History
Date
Name
Owned For
Owner Type
Purchase Details
Closed on
Aug 7, 2020
Sold by
Feingold David Z and Feingold Shaina
Bought by
Segal Steven I and Segal Aviva S
Current Estimated Value
Home Financials for this Owner
Home Financials are based on the most recent Mortgage that was taken out on this home.
Original Mortgage
$395,000
Interest Rate
2.9%
Mortgage Type
New Conventional
Purchase Details
Closed on
Aug 30, 2016
Sold by
Ginsberg Sholom Binyomin
Bought by
Feingold David Z and Feingold Shaina
Home Financials for this Owner
Home Financials are based on the most recent Mortgage that was taken out on this home.
Original Mortgage
$428,000
Interest Rate
3.44%
Mortgage Type
New Conventional
Purchase Details
Closed on
Jul 23, 1999
Sold by
Flynn Katherine J
Bought by
Ginsberg Sholom Binyomin
Create a Home Valuation Report for This Property
The Home Valuation Report is an in-depth analysis detailing your home's value as well as a comparison with similar homes in the area
Home Values in the Area
Average Home Value in this Area
Purchase History
| Date | Buyer | Sale Price | Title Company |
|---|---|---|---|
| Segal Steven I | $625,000 | Edina Realty Title Inc | |
| Feingold David Z | $535,000 | Edina Realty Title Inc | |
| Ginsberg Sholom Binyomin | $313,500 | -- |
Source: Public Records
Mortgage History
| Date | Status | Borrower | Loan Amount |
|---|---|---|---|
| Previous Owner | Segal Steven I | $395,000 | |
| Previous Owner | Feingold David Z | $428,000 |
Source: Public Records
Tax History Compared to Growth
Tax History
| Year | Tax Paid | Tax Assessment Tax Assessment Total Assessment is a certain percentage of the fair market value that is determined by local assessors to be the total taxable value of land and additions on the property. | Land | Improvement |
|---|---|---|---|---|
| 2024 | $11,292 | $748,700 | $336,000 | $412,700 |
| 2023 | $10,010 | $705,700 | $334,400 | $371,300 |
| 2022 | $8,923 | $713,400 | $318,500 | $394,900 |
| 2021 | $8,512 | $636,000 | $277,000 | $359,000 |
| 2020 | $8,824 | $615,900 | $263,900 | $352,000 |
| 2019 | $8,747 | $613,300 | $261,300 | $352,000 |
| 2018 | $8,186 | $590,700 | $248,900 | $341,800 |
| 2017 | $7,415 | $512,600 | $196,800 | $315,800 |
| 2016 | $7,454 | $499,300 | $186,000 | $313,300 |
| 2015 | $7,495 | $487,200 | $173,900 | $313,300 |
| 2014 | -- | $476,700 | $164,900 | $311,800 |
Source: Public Records
Map
Nearby Homes
- 2936 Monterey Ave S
- 4625 Minnetonka Blvd Unit 105
- 3005 Monterey Ave
- 2653 Joppa Ave S
- 4100 Sunset Blvd
- 2930 Salem Ave
- 2744 Toledo Ave S
- 4013 W 31st St Unit 102
- 2544 Huntington Ave
- 2925 Sunset Blvd
- 2910 Vernon Ave S
- 3810 W 31st St Unit 102
- 2825 Drew Ave S
- 3810 W 32nd St
- 4200 Cedarwood Rd
- 3518 Chowen Place
- 3201 Xenwood Ave S
- 2955 Yosemite Ave S
- 2656 Xenwood Ave S
- 2724 Yosemite Ave S
- 2831 Monterey Pkwy
- 4614 W 29th St
- 4614 W 29th St
- 2839 Monterey Pkwy
- 2830 Monterey Pkwy
- 2825 Monterey Pkwy
- 2840 Monterey Pkwy
- 2830 Monterey Pkwy
- 2820 Monterey Pkwy
- 2848 Monterey Pkwy
- 4700 W 29th St
- 4600 W 29th St
- 2821 Monterey Pkwy
- 2901 Natchez Ave S
- 2810 Monterey Pkwy
- 4708 W 29th St
- 2914 Monterey Ave
- 2905 Natchez Ave S
- 2912 Monterey Ave
- 2910 Monterey Ave