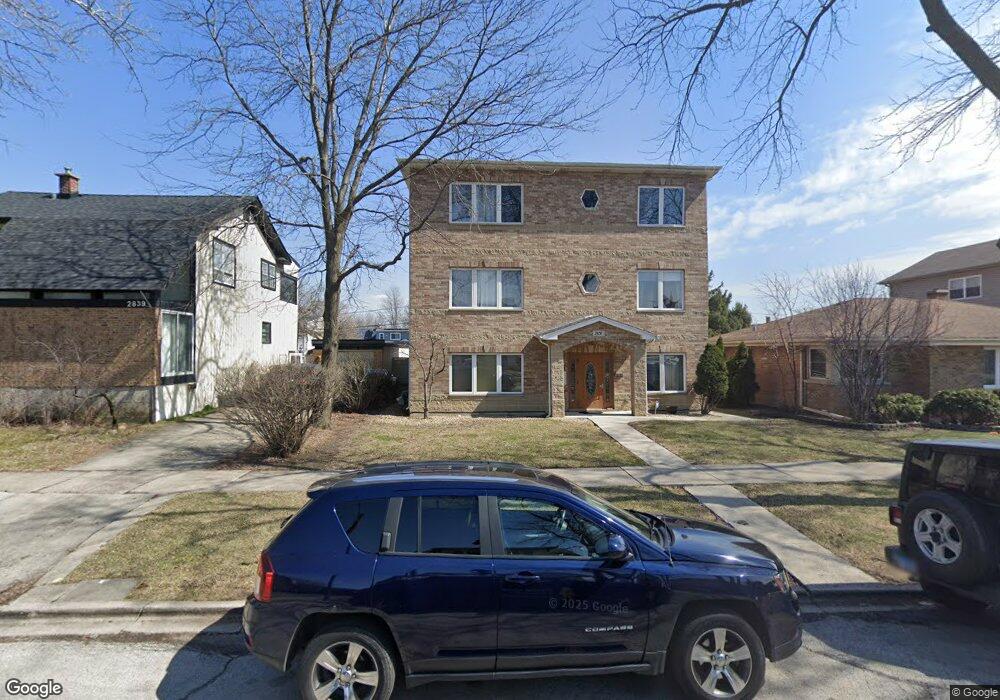
2837 Pearl St Unit 3 Franklin Park, IL 60131
Estimated Value: $210,663 - $259,000
3
Beds
2
Baths
1,700
Sq Ft
$141/Sq Ft
Est. Value
About This Home
This home is located at 2837 Pearl St Unit 3, Franklin Park, IL 60131 and is currently estimated at $239,166, approximately $140 per square foot. 2837 Pearl St Unit 3 is a home located in Cook County with nearby schools including Passow Elementary School, Hester Jr High School, and East Leyden High School.
Ownership History
Date
Name
Owned For
Owner Type
Purchase Details
Closed on
Apr 9, 2023
Sold by
Burke John
Bought by
Cupello Theresa
Current Estimated Value
Purchase Details
Closed on
Jan 25, 2010
Sold by
Cupello Carmen and Burke John
Bought by
Burke John
Purchase Details
Closed on
Jul 20, 2007
Sold by
Cupello Carmen and Burke John G
Bought by
Cupello Carmen A and Burke John G
Home Financials for this Owner
Home Financials are based on the most recent Mortgage that was taken out on this home.
Original Mortgage
$170,000
Interest Rate
7.87%
Mortgage Type
New Conventional
Purchase Details
Closed on
Dec 13, 2004
Sold by
North Star Trust Co
Bought by
Burke John G and Cupello Carmen
Home Financials for this Owner
Home Financials are based on the most recent Mortgage that was taken out on this home.
Original Mortgage
$164,500
Interest Rate
5.77%
Mortgage Type
Purchase Money Mortgage
Create a Home Valuation Report for This Property
The Home Valuation Report is an in-depth analysis detailing your home's value as well as a comparison with similar homes in the area
Home Values in the Area
Average Home Value in this Area
Purchase History
| Date | Buyer | Sale Price | Title Company |
|---|---|---|---|
| Cupello Theresa | -- | None Listed On Document | |
| Burke John | -- | None Available | |
| Cupello Carmen A | -- | Ticor Title | |
| Burke John G | -- | First American Title |
Source: Public Records
Mortgage History
| Date | Status | Borrower | Loan Amount |
|---|---|---|---|
| Previous Owner | Cupello Carmen A | $170,000 | |
| Previous Owner | Burke John G | $164,500 |
Source: Public Records
Tax History Compared to Growth
Tax History
| Year | Tax Paid | Tax Assessment Tax Assessment Total Assessment is a certain percentage of the fair market value that is determined by local assessors to be the total taxable value of land and additions on the property. | Land | Improvement |
|---|---|---|---|---|
| 2024 | $6,137 | $19,984 | $1,885 | $18,099 |
| 2023 | $6,332 | $19,984 | $1,885 | $18,099 |
| 2022 | $6,332 | $19,984 | $1,885 | $18,099 |
| 2021 | $6,576 | $16,602 | $1,361 | $15,241 |
| 2020 | $6,256 | $16,602 | $1,361 | $15,241 |
| 2019 | $6,848 | $19,764 | $1,361 | $18,403 |
| 2018 | $5,882 | $14,577 | $1,151 | $13,426 |
| 2017 | $5,797 | $14,577 | $1,151 | $13,426 |
| 2016 | $5,388 | $14,577 | $1,151 | $13,426 |
| 2015 | $4,370 | $11,190 | $1,047 | $10,143 |
| 2014 | $4,254 | $11,190 | $1,047 | $10,143 |
| 2013 | $3,943 | $11,190 | $1,047 | $10,143 |
Source: Public Records
Map
Nearby Homes
- 9727 Johanna Ave
- 2526 Rose St
- 2829 Elder Ln
- 2807 Elder Ln
- 2628 Willow St
- 9146 Grand Ave Unit 1SE
- 2843 Hawthorne St
- 2632 Westbrook Dr
- 2641 Oak St
- 2749 Scott St
- 3340 Pearl St
- 9044 Walnut Ave
- 3321 Ruby St
- 9907 W Fullerton Ave
- 2728 Spruce St
- 2946 N River Rd
- 2737 Spruce St
- 3137 Sunset Ln
- 2920 Sarah St
- 9504 Nerbonne Ave
- 2837 Pearl St Unit 2
- 2837 Pearl St Unit 1
- 2839 Pearl St
- 2831 Pearl St
- 2829 Pearl St
- 2825 Pearl St
- 2834 Edgington St
- 2849 Pearl St
- 2840 Edgington St
- 2840 Edgington St
- 2823 Pearl St
- 2838 Edgington St
- 2838 Pearl St
- 2834 Pearl St
- 2834 Pearl St
- 2844 Edgington St
- 2844 Edgington St
- 2840 Pearl St
- 2840 Pearl St
- 2832 Pearl St