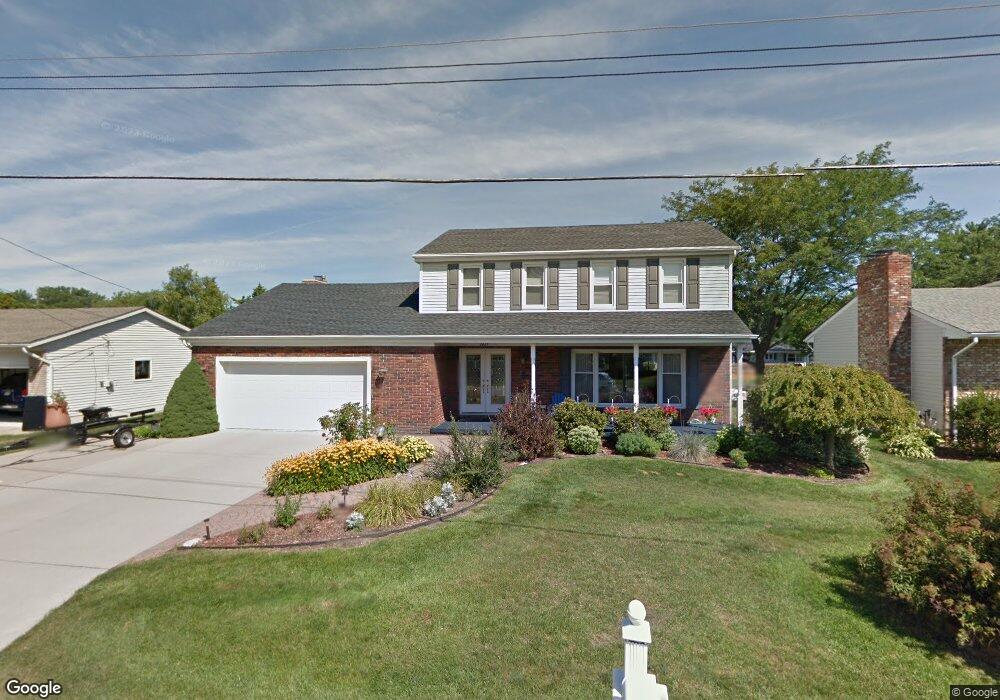
2837 Riverwood Ct Port Huron, MI 48060
Estimated Value: $372,000 - $407,000
4
Beds
3
Baths
2,066
Sq Ft
$188/Sq Ft
Est. Value
About This Home
This home is located at 2837 Riverwood Ct, Port Huron, MI 48060 and is currently estimated at $389,263, approximately $188 per square foot. 2837 Riverwood Ct is a home located in St. Clair County with nearby schools including H.D. Crull Elementary School, Holland Woods Middle School, and Port Huron Northern High School.
Ownership History
Date
Name
Owned For
Owner Type
Purchase Details
Closed on
Dec 17, 2024
Sold by
Wilson James L and Wilson Marcie L
Bought by
James L Wilson And Marcie L Wilson Revocable and Wilson
Current Estimated Value
Purchase Details
Closed on
Mar 21, 2019
Sold by
Shook David E
Bought by
Shook David E
Purchase Details
Closed on
Mar 15, 2019
Sold by
Shook David E
Bought by
Shook David E and Shook Trust
Purchase Details
Closed on
Nov 3, 2008
Sold by
Shook David E
Bought by
The David E Shook Trust
Purchase Details
Closed on
Aug 21, 2006
Sold by
Zimmer James F and Zimmer Barbara H
Bought by
The David Edgar Shook Trust
Create a Home Valuation Report for This Property
The Home Valuation Report is an in-depth analysis detailing your home's value as well as a comparison with similar homes in the area
Home Values in the Area
Average Home Value in this Area
Purchase History
| Date | Buyer | Sale Price | Title Company |
|---|---|---|---|
| James L Wilson And Marcie L Wilson Revocable | -- | None Listed On Document | |
| Shook David E | -- | None Listed On Document | |
| Shook David E | -- | None Listed On Document | |
| Shook David E | -- | None Available | |
| The David E Shook Trust | -- | None Available | |
| The David Edgar Shook Trust | $253,500 | None Available |
Source: Public Records
Tax History Compared to Growth
Tax History
| Year | Tax Paid | Tax Assessment Tax Assessment Total Assessment is a certain percentage of the fair market value that is determined by local assessors to be the total taxable value of land and additions on the property. | Land | Improvement |
|---|---|---|---|---|
| 2025 | $6,841 | $179,700 | $0 | $0 |
| 2024 | $6,075 | $170,300 | $0 | $0 |
| 2023 | $5,738 | $148,300 | $0 | $0 |
| 2022 | $6,226 | $114,300 | $0 | $0 |
| 2021 | $4,205 | $103,600 | $0 | $0 |
| 2020 | $4,253 | $103,300 | $103,300 | $0 |
| 2019 | $4,176 | $108,400 | $0 | $0 |
| 2018 | $4,083 | $108,400 | $0 | $0 |
| 2017 | $3,642 | $99,200 | $0 | $0 |
| 2016 | $3,144 | $99,200 | $0 | $0 |
| 2015 | $3,085 | $91,300 | $91,300 | $0 |
| 2014 | $3,085 | $87,100 | $87,100 | $0 |
| 2013 | -- | $84,700 | $0 | $0 |
Source: Public Records
Map
Nearby Homes
- 2838 Elmwood St
- 2549 Riverwood Dr
- 2806 Woodstock Dr
- 0000 Water St
- 2610 Strawberry Ln
- V/L #4 Water St
- V/L #6 Water St
- V/L #5 Water St
- V/L #8 Water St
- V/L #3 Water St
- 2215 Hancock St
- 0000 Campau Ave
- 1819 Riverside Dr
- 1907 Riverside Dr
- 2857 Riverside Dr
- 2812 19th Ave
- 2475 Sharon Ln
- 0000 Manuel St
- 00 Campau Ave
- 1649 Whipple St
- 2825 Riverwood Ct
- 2821 Riverwood Ct
- 2824 Riverwood Ct
- 2845 Riverwood Ct
- 2828 Riverwood Ct
- 2820 Riverwood Ct
- 2815 Riverwood Ct
- 2822 Elmwood St
- 2851 Riverwood Ct
- 2830 Elmwood St
- 2810 Riverwood Ct
- 2816 Elmwood St
- 2846 Elmwood St
- 2857 Riverwood Ct
- 2340 Riverwood Dr
- 2804 Elmwood St
- 2800 Elmwood St
- 2800 Riverwood Ct
- 2854 Elmwood St
- 2346 Riverwood Dr