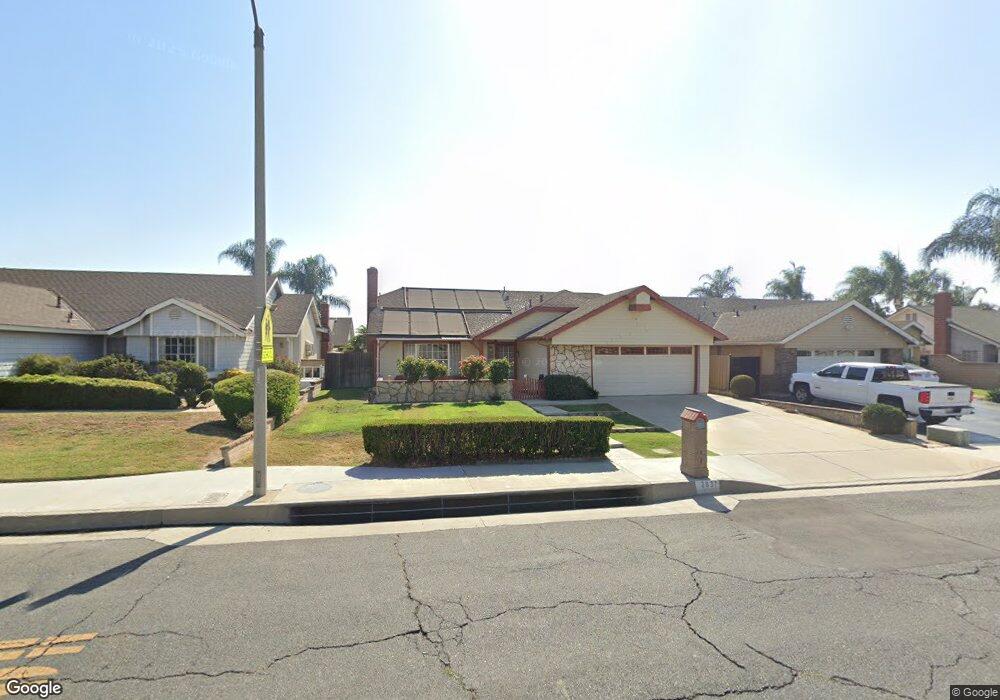
2837 S Cucamonga Ave Ontario, CA 91761
Ontario Ranch NeighborhoodEstimated Value: $732,464 - $792,000
3
Beds
2
Baths
1,766
Sq Ft
$429/Sq Ft
Est. Value
About This Home
This home is located at 2837 S Cucamonga Ave, Ontario, CA 91761 and is currently estimated at $758,116, approximately $429 per square foot. 2837 S Cucamonga Ave is a home located in San Bernardino County with nearby schools including Liberty Elementary School, Woodcrest Junior High, and Chino High School.
Ownership History
Date
Name
Owned For
Owner Type
Purchase Details
Closed on
Nov 17, 2020
Sold by
Brownley Mark Lyon
Bought by
Brownley Mark L and The Mark Brownley Living Trust
Current Estimated Value
Purchase Details
Closed on
Mar 20, 2012
Sold by
Brownley Mark L
Bought by
Brownley Mark L
Home Financials for this Owner
Home Financials are based on the most recent Mortgage that was taken out on this home.
Original Mortgage
$110,000
Outstanding Balance
$73,737
Interest Rate
3.37%
Mortgage Type
New Conventional
Estimated Equity
$684,379
Purchase Details
Closed on
Jun 3, 2002
Sold by
Brownley Tari L
Bought by
Brownley Mark L
Purchase Details
Closed on
Aug 1, 2001
Sold by
Brownley Mark L
Bought by
Brownley Mark L and Brownley Tari L
Home Financials for this Owner
Home Financials are based on the most recent Mortgage that was taken out on this home.
Original Mortgage
$181,000
Interest Rate
7.19%
Mortgage Type
Stand Alone First
Purchase Details
Closed on
May 23, 2000
Sold by
Long Walter E
Bought by
Brownley Mark L and Heslop Tari L
Home Financials for this Owner
Home Financials are based on the most recent Mortgage that was taken out on this home.
Original Mortgage
$176,600
Interest Rate
8.63%
Create a Home Valuation Report for This Property
The Home Valuation Report is an in-depth analysis detailing your home's value as well as a comparison with similar homes in the area
Home Values in the Area
Average Home Value in this Area
Purchase History
| Date | Buyer | Sale Price | Title Company |
|---|---|---|---|
| Brownley Mark L | -- | None Available | |
| Brownley Mark L | -- | First American Title Company | |
| Brownley Mark L | -- | -- | |
| Brownley Mark L | -- | First American Title | |
| Brownley Mark L | $186,000 | First American Title |
Source: Public Records
Mortgage History
| Date | Status | Borrower | Loan Amount |
|---|---|---|---|
| Open | Brownley Mark L | $110,000 | |
| Closed | Brownley Mark L | $181,000 | |
| Closed | Brownley Mark L | $176,600 |
Source: Public Records
Tax History Compared to Growth
Tax History
| Year | Tax Paid | Tax Assessment Tax Assessment Total Assessment is a certain percentage of the fair market value that is determined by local assessors to be the total taxable value of land and additions on the property. | Land | Improvement |
|---|---|---|---|---|
| 2025 | $3,095 | $280,126 | $97,947 | $182,179 |
| 2024 | $3,095 | $274,633 | $96,026 | $178,607 |
| 2023 | $3,011 | $269,248 | $94,143 | $175,105 |
| 2022 | $2,994 | $263,969 | $92,297 | $171,672 |
| 2021 | $2,936 | $258,793 | $90,487 | $168,306 |
| 2020 | $2,822 | $256,139 | $89,559 | $166,580 |
| 2019 | $2,772 | $251,117 | $87,803 | $163,314 |
| 2018 | $2,710 | $246,193 | $86,081 | $160,112 |
| 2017 | $2,661 | $241,366 | $84,393 | $156,973 |
| 2016 | $2,489 | $236,633 | $82,738 | $153,895 |
| 2015 | $2,439 | $233,078 | $81,495 | $151,583 |
| 2014 | $2,391 | $228,513 | $79,899 | $148,614 |
Source: Public Records
Map
Nearby Homes
- 1020 E Tam o Shanter Ct
- 2708 S Parkside Dr
- 2919 S Caldwell Ave
- 2453 S Marigold Place
- 2437 S Garfield Place
- 2408 S Taylor Place
- 4235 S Gasly Paseo
- 0 Vineyard Unit CV25067044
- 4245 S Grasly Paseo
- 4233 S Grasly Paseo
- 0 Phillips Unit CV23180894
- 2535 S Imperial Place
- 2817 S Lassen Ave
- 2413 S Parco Ave
- 2424 S Lake Ave
- 513 E Fairfield Ct
- 1456 E Philadelphia St Unit 134
- 1456 E Philadelphia St Unit 378
- 1456 E Philadelphia St
- 1456 E Philadelphia St Unit 279
- 2831 S Cucamonga Ave
- 2841 S Cucamonga Ave
- 2836 S Marigold Ave
- 2845 S Cucamonga Ave
- 2825 S Cucamonga Ave
- 2840 S Marigold Ave
- 2830 S Marigold Ave
- 2844 S Marigold Ave
- 2824 S Marigold Ave
- 2851 S Cucamonga Ave
- 2819 S Cucamonga Ave
- 2858 S Cucamonga Ave
- 2850 S Cucamonga Ave
- 2850 S Marigold Ave
- 2842 S Cucamonga Ave
- 2818 S Marigold Ave
- 2878 S Cucamonga Ave
- 2901 S Cucamonga Ave
- 2815 S Cucamonga Ave
- 2834 S Cucamonga Ave