Estimated Value: $387,000 - $418,000
3
Beds
2
Baths
1,332
Sq Ft
$304/Sq Ft
Est. Value
About This Home
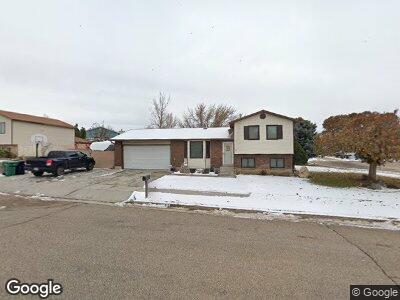
This home is located at 2837 W 4425 S, Roy, UT 84067 and is currently estimated at $404,278, approximately $303 per square foot. 2837 W 4425 S is a home located in Weber County with nearby schools including Midland School, Sand Ridge Junior High School, and Roy High School.
Ownership History
Date
Name
Owned For
Owner Type
Purchase Details
Closed on
Apr 25, 2016
Bought by
Barnes Joshua M
Current Estimated Value
Home Financials for this Owner
Home Financials are based on the most recent Mortgage that was taken out on this home.
Original Mortgage
$90,000
Outstanding Balance
$72,448
Interest Rate
3.59%
Estimated Equity
$330,529
Purchase Details
Closed on
Feb 20, 2013
Sold by
Barnes Joshua M and Barnes Gary M
Bought by
Barnes Joshua M and Barnes Gary M
Home Financials for this Owner
Home Financials are based on the most recent Mortgage that was taken out on this home.
Original Mortgage
$100,745
Interest Rate
3.75%
Mortgage Type
FHA
Purchase Details
Closed on
Jan 21, 2004
Sold by
Gochis Jim L and Gochis Julie B
Bought by
Barnes Joshua M and Barnes Gary M
Home Financials for this Owner
Home Financials are based on the most recent Mortgage that was taken out on this home.
Original Mortgage
$118,755
Interest Rate
5.86%
Mortgage Type
Purchase Money Mortgage
Create a Home Valuation Report for This Property
The Home Valuation Report is an in-depth analysis detailing your home's value as well as a comparison with similar homes in the area
Home Values in the Area
Average Home Value in this Area
Purchase History
| Date | Buyer | Sale Price | Title Company |
|---|---|---|---|
| Barnes Joshua M | -- | -- | |
| Barnes Joshua M | -- | Security Title Of Davis Coun | |
| Barnes Joshua M | -- | Mountain View Title |
Source: Public Records
Mortgage History
| Date | Status | Borrower | Loan Amount |
|---|---|---|---|
| Open | Barnes Joshua M | $90,000 | |
| Closed | Barnes Joshua M | -- | |
| Previous Owner | Barnes Joshua M | $100,745 | |
| Previous Owner | Barnes Joshua M | $118,755 |
Source: Public Records
Tax History Compared to Growth
Tax History
| Year | Tax Paid | Tax Assessment Tax Assessment Total Assessment is a certain percentage of the fair market value that is determined by local assessors to be the total taxable value of land and additions on the property. | Land | Improvement |
|---|---|---|---|---|
| 2024 | $2,347 | $204,049 | $71,508 | $132,541 |
| 2023 | $2,144 | $185,350 | $71,317 | $114,033 |
| 2022 | $2,236 | $200,200 | $60,501 | $139,699 |
| 2021 | $2,083 | $310,000 | $75,002 | $234,998 |
| 2020 | $1,802 | $244,000 | $75,002 | $168,998 |
| 2019 | $1,771 | $226,000 | $44,976 | $181,024 |
| 2018 | $1,611 | $192,000 | $44,976 | $147,024 |
| 2017 | $1,549 | $173,000 | $43,029 | $129,971 |
| 2016 | $1,405 | $83,573 | $24,773 | $58,800 |
| 2015 | $1,309 | $79,490 | $24,773 | $54,717 |
| 2014 | $1,145 | $67,226 | $24,773 | $42,453 |
Source: Public Records
Map
Nearby Homes