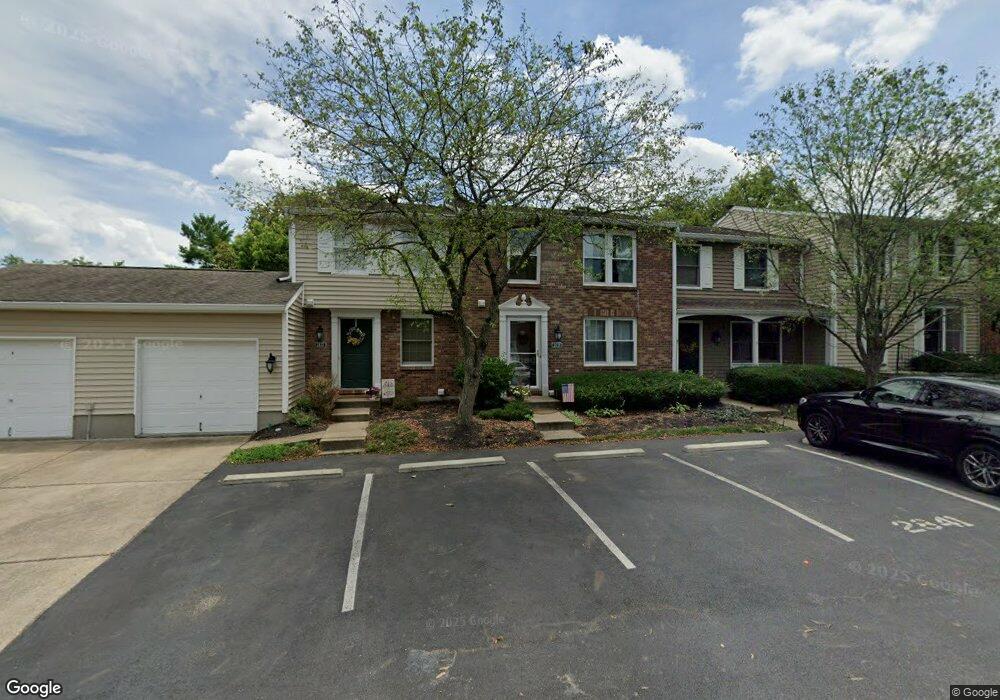
2839 Millbank Row Unit 103 Maineville, OH 45039
Landen NeighborhoodEstimated Value: $212,000 - $236,000
3
Beds
3
Baths
1,760
Sq Ft
$126/Sq Ft
Est. Value
About This Home
This home is located at 2839 Millbank Row Unit 103, Maineville, OH 45039 and is currently estimated at $222,152, approximately $126 per square foot. 2839 Millbank Row Unit 103 is a home located in Warren County with nearby schools including Kings Junior High School, Kings High School, and St. Margaret of York School.
Ownership History
Date
Name
Owned For
Owner Type
Purchase Details
Closed on
Sep 9, 2021
Sold by
Penafiel Christian C and Penafiel Robin L
Bought by
Rupe Jennifer
Current Estimated Value
Home Financials for this Owner
Home Financials are based on the most recent Mortgage that was taken out on this home.
Original Mortgage
$155,200
Outstanding Balance
$141,010
Interest Rate
2.7%
Mortgage Type
New Conventional
Estimated Equity
$81,142
Purchase Details
Closed on
Aug 28, 2020
Sold by
Penafiel Christian C and Holcomb Robin L
Bought by
Penafiel Christian C and Penafiel Robin L
Purchase Details
Closed on
Mar 24, 2009
Sold by
Cline Sarah and Cline Sarah R
Bought by
Penafiel Christian C and Holcomb Robin L
Home Financials for this Owner
Home Financials are based on the most recent Mortgage that was taken out on this home.
Original Mortgage
$106,362
Interest Rate
5.22%
Mortgage Type
FHA
Purchase Details
Closed on
May 31, 2006
Sold by
Smith Maurice A and Smith Shauna
Bought by
Cline Sarah
Home Financials for this Owner
Home Financials are based on the most recent Mortgage that was taken out on this home.
Original Mortgage
$30,000
Interest Rate
6.72%
Mortgage Type
Unknown
Purchase Details
Closed on
Sep 16, 2002
Sold by
Glover Robert
Bought by
Smith Maurice A
Home Financials for this Owner
Home Financials are based on the most recent Mortgage that was taken out on this home.
Original Mortgage
$97,186
Interest Rate
6.54%
Mortgage Type
New Conventional
Purchase Details
Closed on
Jun 17, 1998
Sold by
Tussing Cindy J
Bought by
Glover Robert C and Glover Joy B
Purchase Details
Closed on
Jan 30, 1997
Sold by
Plymire Steven E
Bought by
Tussing Cindy J
Home Financials for this Owner
Home Financials are based on the most recent Mortgage that was taken out on this home.
Original Mortgage
$80,900
Interest Rate
7.81%
Mortgage Type
FHA
Purchase Details
Closed on
Feb 1, 1991
Sold by
Barger Randall E and Barger Randall E
Bought by
Plymire and Plymire Steven E
Purchase Details
Closed on
Oct 26, 1987
Sold by
Stuttman Richard L and Stuttman Ba
Bought by
Barger and Barger Randall E
Purchase Details
Closed on
Aug 3, 1983
Sold by
Ryan Homes & Inc
Bought by
Stuttman Stuttman and Stuttman Richard L
Purchase Details
Closed on
Jun 24, 1983
Sold by
Ryan Homes & Inc
Bought by
Ryan Homes & Inc.
Create a Home Valuation Report for This Property
The Home Valuation Report is an in-depth analysis detailing your home's value as well as a comparison with similar homes in the area
Home Values in the Area
Average Home Value in this Area
Purchase History
| Date | Buyer | Sale Price | Title Company |
|---|---|---|---|
| Rupe Jennifer | $160,000 | Ivy Pointe Title Llc | |
| Penafiel Christian C | -- | None Available | |
| Penafiel Christian C | $108,333 | Lawyers Title Of Cinti | |
| Cline Sarah | $110,000 | Central States Title Agency | |
| Smith Maurice A | $99,500 | -- | |
| Glover Robert C | $83,500 | -- | |
| Tussing Cindy J | $83,500 | -- | |
| Plymire | $66,500 | -- | |
| Barger | $61,000 | -- | |
| Stuttman Stuttman | $67,700 | -- | |
| Ryan Homes & Inc. | -- | -- |
Source: Public Records
Mortgage History
| Date | Status | Borrower | Loan Amount |
|---|---|---|---|
| Open | Rupe Jennifer | $155,200 | |
| Previous Owner | Penafiel Christian C | $106,362 | |
| Previous Owner | Cline Sarah | $30,000 | |
| Previous Owner | Smith Maurice A | $97,186 | |
| Previous Owner | Tussing Cindy J | $80,900 |
Source: Public Records
Tax History Compared to Growth
Tax History
| Year | Tax Paid | Tax Assessment Tax Assessment Total Assessment is a certain percentage of the fair market value that is determined by local assessors to be the total taxable value of land and additions on the property. | Land | Improvement |
|---|---|---|---|---|
| 2024 | $2,924 | $56,630 | $14,000 | $42,630 |
| 2023 | $2,420 | $42,094 | $4,305 | $37,789 |
| 2022 | $2,381 | $42,095 | $4,305 | $37,790 |
| 2021 | $2,043 | $42,095 | $4,305 | $37,790 |
| 2020 | $1,924 | $34,223 | $3,500 | $30,723 |
| 2019 | $1,950 | $34,223 | $3,500 | $30,723 |
| 2018 | $1,956 | $34,223 | $3,500 | $30,723 |
| 2017 | $2,054 | $32,067 | $2,979 | $29,089 |
| 2016 | $2,107 | $32,067 | $2,979 | $29,089 |
| 2015 | $1,917 | $32,067 | $2,979 | $29,089 |
| 2014 | $1,942 | $30,540 | $2,840 | $27,700 |
| 2013 | $1,945 | $37,700 | $3,500 | $34,200 |
Source: Public Records
Map
Nearby Homes
- 2839 Mossy Brink Ct
- 2877 Mossy Brink Ct Unit 70
- 2954 Mossy Brink Ct Unit 40
- 8740 Exeter Place
- 8950 Wexford Place
- 8480 Island Pines Place
- 8732 Columbia Rd
- 4000 Orchard Ln
- 9023 Country View Ln
- 8305 Woodbridge Ln
- 9623 Greenery Ct Unit 313B
- 8309 Marigold Ln
- 9530 Greenery Ct Unit 305C
- 8508 Southland Dr
- 2284 Cosmos Dr
- 3536 Stoneboat Ct
- 2612 Virgie Ct
- 3204 Dogwood Ct N
- 2845 Columbia Trail
- 3444 Cutter Ln
- 2837 Millbank Row
- 2841 Millbank Row
- 2841 Millbank Row Unit 102
- 2843 Millbank Row
- 2845 Millbank Row Unit 100
- 2847 Millbank Row
- 2872 Mossy Brink Ct
- 2876 Mossy Brink Ct Unit 56
- 2874 Mossy Brink Ct
- 2870 Mossy Brink Ct
- 2878 Mossy Brink Ct Unit 57
- 2880 Mossy Brink Ct
- 2840 Millbank Row Unit 111
- 2867 Millbank Row Unit 110
- 2842 Millbank Row
- 2830 Millbank Row
- 2844 Millbank Row Unit 113
- 2869 Millbank Row Unit 109
- 2846 Millbank Row Unit 114
- 2828 Millbank Row