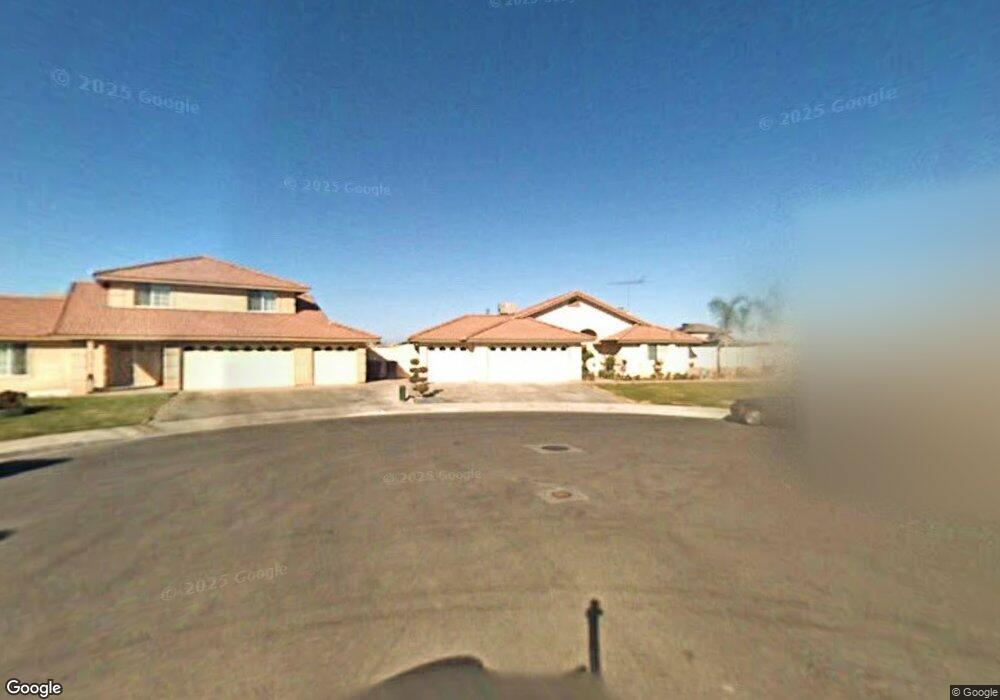
284 Burns Ct Shafter, CA 93263
Estimated Value: $320,000 - $410,000
4
Beds
2
Baths
1,594
Sq Ft
$230/Sq Ft
Est. Value
About This Home
This home is located at 284 Burns Ct, Shafter, CA 93263 and is currently estimated at $366,237, approximately $229 per square foot. 284 Burns Ct is a home located in Kern County with nearby schools including Golden Oak Elementary School, Redwood Elementary School, and Shafter High School.
Ownership History
Date
Name
Owned For
Owner Type
Purchase Details
Closed on
Dec 4, 2025
Sold by
Nolasco Jesus F and Nolasco Teresa
Bought by
Nolasco Jesus and Nolasco Teresa
Current Estimated Value
Purchase Details
Closed on
May 16, 2002
Sold by
Parade
Bought by
Nolasco Jesus F and Nolasco Teresa
Home Financials for this Owner
Home Financials are based on the most recent Mortgage that was taken out on this home.
Original Mortgage
$66,300
Interest Rate
6.78%
Create a Home Valuation Report for This Property
The Home Valuation Report is an in-depth analysis detailing your home's value as well as a comparison with similar homes in the area
Home Values in the Area
Average Home Value in this Area
Purchase History
| Date | Buyer | Sale Price | Title Company |
|---|---|---|---|
| Nolasco Jesus | -- | None Listed On Document | |
| Nolasco Family Trust | -- | None Listed On Document | |
| Nolasco Jesus F | $106,500 | Fidelity National Title Co |
Source: Public Records
Mortgage History
| Date | Status | Borrower | Loan Amount |
|---|---|---|---|
| Previous Owner | Nolasco Jesus F | $66,300 |
Source: Public Records
Tax History
| Year | Tax Paid | Tax Assessment Tax Assessment Total Assessment is a certain percentage of the fair market value that is determined by local assessors to be the total taxable value of land and additions on the property. | Land | Improvement |
|---|---|---|---|---|
| 2025 | $2,041 | $153,935 | $28,956 | $124,979 |
| 2024 | $1,976 | $150,918 | $28,389 | $122,529 |
| 2023 | $1,976 | $147,960 | $27,833 | $120,127 |
| 2022 | $1,907 | $145,060 | $27,288 | $117,772 |
| 2021 | $1,842 | $142,216 | $26,753 | $115,463 |
| 2020 | $1,789 | $140,759 | $26,479 | $114,280 |
| 2019 | $1,786 | $140,759 | $26,479 | $114,280 |
| 2018 | $1,720 | $135,295 | $25,451 | $109,844 |
| 2017 | $1,710 | $132,643 | $24,952 | $107,691 |
| 2016 | $1,612 | $130,043 | $24,463 | $105,580 |
| 2015 | $1,575 | $128,091 | $24,096 | $103,995 |
| 2014 | $1,516 | $125,582 | $23,624 | $101,958 |
Source: Public Records
Map
Nearby Homes
Your Personal Tour Guide
Ask me questions while you tour the home.