284 Common St Walpole, MA 02081
Estimated Value: $830,000 - $1,095,000
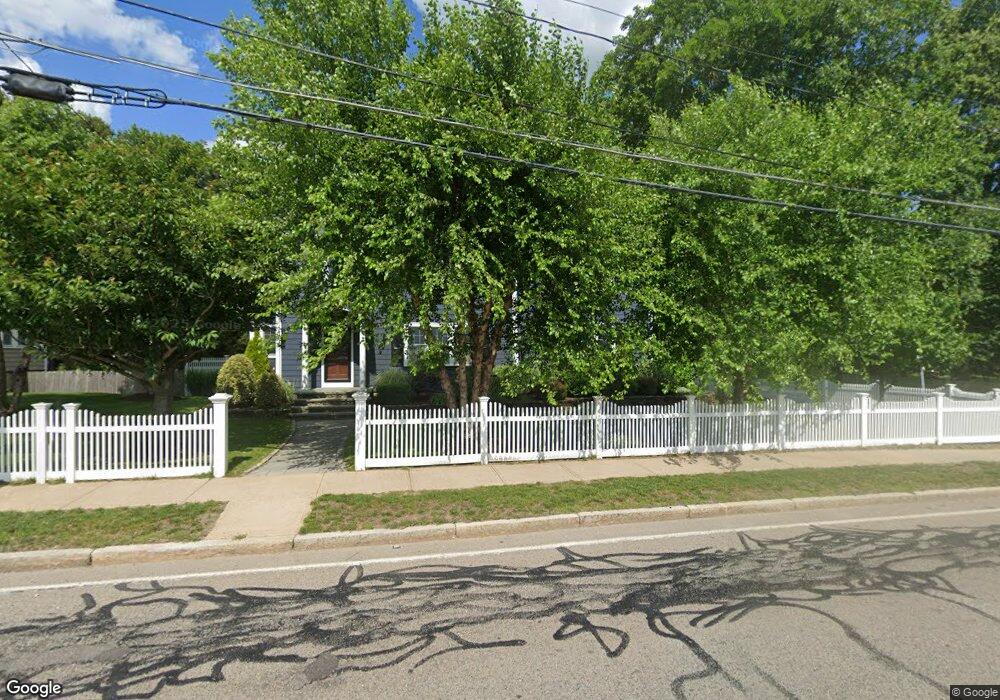
About This Home
This home is located at 284 Common St, Walpole, MA 02081 and is currently estimated at $988,158, approximately $315 per square foot. 284 Common St is a home located in Norfolk County with nearby schools including Boyden School, Eleanor N. Johnson Middle School, and Walpole High School.
Ownership History
We collect this data history from publicly available records. To have your information removed, we recommend requesting removal directly through your county’s website.
Purchase Details
Home Financials for this Owner
Home Financials are based on the most recent Mortgage that was taken out on this home.Home Values in the Area
Average Home Value in this Area
Purchase History
We collect this data history from publicly available records. To have your information removed, we recommend requesting removal directly through your county’s website.
| Date | Buyer | Sale Price | Title Company |
|---|---|---|---|
| $178,250 | -- |
Mortgage History
We collect this data history from publicly available records. To have your information removed, we recommend requesting removal directly through your county’s website.
| Date | Status | Borrower | Loan Amount |
|---|---|---|---|
| Closed | $200,000 | ||
| Closed | $400,000 | ||
| Closed | $100,000 | ||
| Closed | $218,875 | ||
| Closed | $174,000 | ||
| Closed | $251,500 | ||
| Closed | $190,000 | ||
| Closed | $194,000 |
Tax History
We collect this data history from publicly available records. To have your information removed, we recommend requesting removal directly through your county’s website.
| Year | Tax Paid | Tax Assessment Tax Assessment Total Assessment is a certain percentage of the fair market value that is determined by local assessors to be the total taxable value of land and additions on the property. | Land | Improvement |
|---|---|---|---|---|
| 2025 | $11,759 | $916,500 | $333,800 | $582,700 |
| 2024 | $11,343 | $858,000 | $320,900 | $537,100 |
| 2023 | $10,780 | $776,100 | $279,100 | $497,000 |
| 2022 | $10,016 | $692,700 | $258,400 | $434,300 |
| 2021 | $9,532 | $642,300 | $243,800 | $398,500 |
| 2020 | $9,136 | $609,500 | $230,000 | $379,500 |
| 2019 | $8,794 | $582,400 | $221,200 | $361,200 |
| 2018 | $8,792 | $575,800 | $213,100 | $362,700 |
| 2017 | $8,499 | $554,400 | $204,800 | $349,600 |
| 2016 | $7,970 | $512,200 | $196,900 | $315,300 |
| 2015 | $7,671 | $488,600 | $187,400 | $301,200 |
| 2014 | $7,327 | $464,900 | $187,400 | $277,500 |
Map
- 278 Common St
- 21 Grover St
- 261 Stone St
- 145 South St Unit 6
- 24 Riverside Place
- 85 Lewis Ave Unit 85
- 85 Lewis Ave
- 510 Common St
- 8 Rainbow Pond Dr Unit 5
- 19 Rainbow Pond Dr Unit B2
- 560 Common St
- 120 Spring St
- 2 Rainbow Pond Dr Unit 7
- 979 Main St Unit 1
- 979 Main St Unit 3
- 979 Main St Unit 6
- 979 Main St Unit 5
- 979 Main St Unit 8
- 979 Main St Unit 2
- 979 Main St Unit 4
- 280 Common St
- 25 Prospect St
- 8 Lake Ave
- 23 Prospect St
- 274 Common St
- 1 Lake Ave
- 19 Prospect St
- 15 Lake Ave
- 34 Prospect St
- 320 Common St
- 268 Common St Unit 1
- 268 Common St Unit 2
- 21 Lake Ave
- 15 Massachusetts Ave
- 7 Massachusetts Ave Unit 7
- 7 Massachusetts Ave
- 24 Prospect St
- 16 Prospect St
- 40 Lake Ave
- 10 Prospect St
Ask me questions while you tour the home.