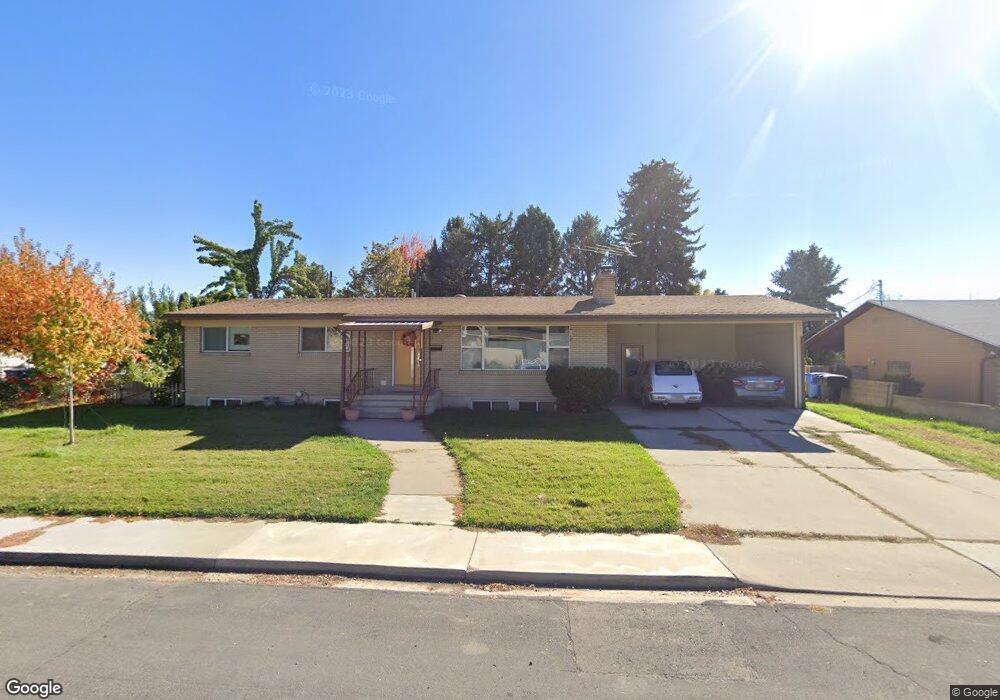
284 E 1910 S Orem, UT 84058
Cherry Hill NeighborhoodEstimated Value: $536,000 - $565,000
6
Beds
3
Baths
2,688
Sq Ft
$204/Sq Ft
Est. Value
About This Home
This home is located at 284 E 1910 S, Orem, UT 84058 and is currently estimated at $548,131, approximately $203 per square foot. 284 E 1910 S is a home located in Utah County with nearby schools including Cherry Hill Elementary School, Lakeridge Jr High School, and Mountain View High School.
Ownership History
Date
Name
Owned For
Owner Type
Purchase Details
Closed on
Sep 19, 2005
Sold by
Crane Mark Eugene
Bought by
Crane Mark Eugene and Crane Christine A
Current Estimated Value
Purchase Details
Closed on
Apr 15, 2005
Sold by
Green Eleanor W
Bought by
Green Eleanor W and Hullinger Rosemary O
Create a Home Valuation Report for This Property
The Home Valuation Report is an in-depth analysis detailing your home's value as well as a comparison with similar homes in the area
Home Values in the Area
Average Home Value in this Area
Purchase History
| Date | Buyer | Sale Price | Title Company |
|---|---|---|---|
| Crane Mark Eugene | -- | Eagle Pointe Title Insuranc | |
| Crane Mark Eugene | -- | Provo Land Title Co | |
| Green Eleanor W | -- | -- |
Source: Public Records
Tax History
| Year | Tax Paid | Tax Assessment Tax Assessment Total Assessment is a certain percentage of the fair market value that is determined by local assessors to be the total taxable value of land and additions on the property. | Land | Improvement |
|---|---|---|---|---|
| 2025 | $2,199 | $277,860 | -- | -- |
| 2024 | $2,199 | $268,950 | $0 | $0 |
| 2023 | $2,031 | $266,915 | $0 | $0 |
| 2022 | $1,982 | $252,395 | $0 | $0 |
| 2021 | $1,808 | $348,600 | $133,000 | $215,600 |
| 2020 | $1,666 | $315,700 | $106,400 | $209,300 |
| 2019 | $1,487 | $293,000 | $92,200 | $200,800 |
| 2018 | $1,440 | $271,100 | $88,700 | $182,400 |
| 2017 | $1,380 | $139,205 | $0 | $0 |
| 2016 | $1,405 | $130,680 | $0 | $0 |
| 2015 | $1,414 | $124,355 | $0 | $0 |
| 2014 | $1,320 | $115,610 | $0 | $0 |
Source: Public Records
Map
Nearby Homes
Your Personal Tour Guide
Ask me questions while you tour the home.