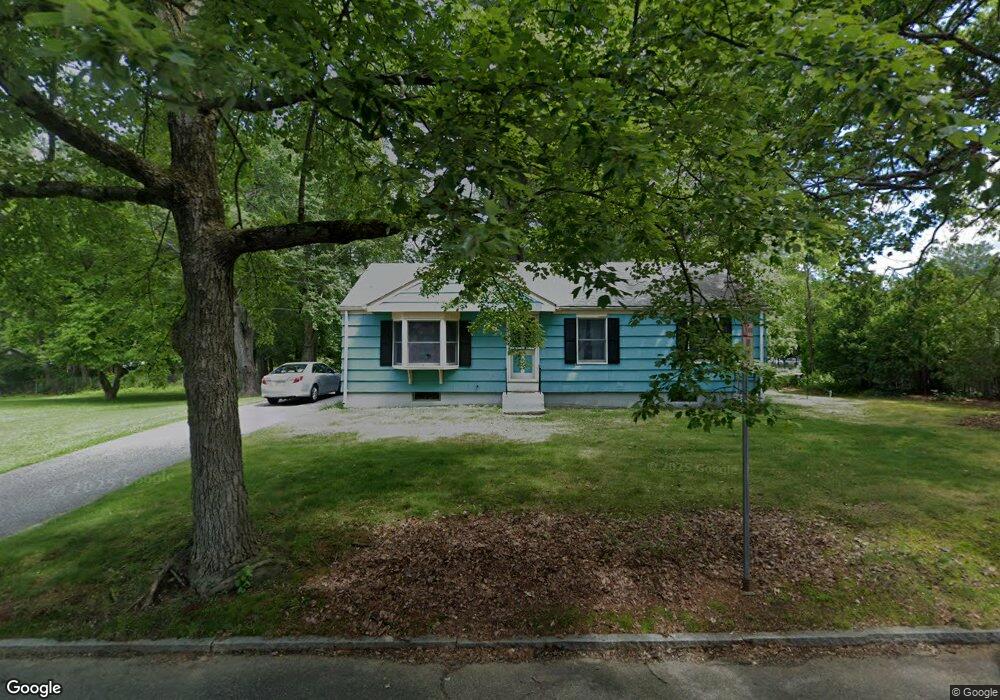
284 Holcomb Rd Springfield, MA 01118
Sixteen Acres NeighborhoodEstimated Value: $236,000 - $295,000
3
Beds
1
Bath
948
Sq Ft
$292/Sq Ft
Est. Value
About This Home
This home is located at 284 Holcomb Rd, Springfield, MA 01118 and is currently estimated at $276,617, approximately $291 per square foot. 284 Holcomb Rd is a home located in Hampden County with nearby schools including Arthur T Talmadge Elementary School, M Marcus Kiley Middle, and Springfield High School of Science and Technology.
Ownership History
Date
Name
Owned For
Owner Type
Purchase Details
Closed on
Oct 15, 2018
Sold by
Goodrich Douglas E
Bought by
Blaxland Jason
Current Estimated Value
Purchase Details
Closed on
Jul 21, 1993
Sold by
Ma Hsng Fin Agency
Bought by
Blaxland Linda L and Goodrich Douglas E
Purchase Details
Closed on
Jun 1, 1993
Sold by
Abdow Diane E
Bought by
Ma Hsng Fin Agency
Purchase Details
Closed on
Oct 6, 1989
Sold by
Bubar Fern D
Bought by
Abdow Diane E
Create a Home Valuation Report for This Property
The Home Valuation Report is an in-depth analysis detailing your home's value as well as a comparison with similar homes in the area
Home Values in the Area
Average Home Value in this Area
Purchase History
| Date | Buyer | Sale Price | Title Company |
|---|---|---|---|
| Blaxland Jason | -- | -- | |
| Blaxland Linda L | $65,000 | -- | |
| Ma Hsng Fin Agency | $62,050 | -- | |
| Abdow Diane E | $96,000 | -- |
Source: Public Records
Mortgage History
| Date | Status | Borrower | Loan Amount |
|---|---|---|---|
| Previous Owner | Abdow Diane E | $88,500 | |
| Previous Owner | Abdow Diane E | $17,500 |
Source: Public Records
Tax History
| Year | Tax Paid | Tax Assessment Tax Assessment Total Assessment is a certain percentage of the fair market value that is determined by local assessors to be the total taxable value of land and additions on the property. | Land | Improvement |
|---|---|---|---|---|
| 2025 | $3,621 | $230,900 | $59,700 | $171,200 |
| 2024 | $3,300 | $205,500 | $59,700 | $145,800 |
| 2023 | $3,166 | $185,700 | $56,800 | $128,900 |
| 2022 | $3,105 | $165,000 | $56,800 | $108,200 |
| 2021 | $2,999 | $158,700 | $51,600 | $107,100 |
| 2020 | $3,004 | $153,800 | $51,600 | $102,200 |
| 2019 | $2,901 | $147,400 | $51,600 | $95,800 |
| 2018 | $2,547 | $129,400 | $51,600 | $77,800 |
| 2017 | $2,558 | $130,100 | $51,600 | $78,500 |
| 2016 | $2,402 | $122,200 | $51,600 | $70,600 |
| 2015 | $2,246 | $114,200 | $51,600 | $62,600 |
Source: Public Records
Map
Nearby Homes
- 41 Hillside Dr
- 25 Laurelwood Ln
- 24 Wands St
- 85 Talmadge Dr
- 86 Talmadge Dr
- 81 W Crystal Brook Dr
- 86 Wildwood Ave
- 17 Pebble Mill Rd
- 49 Corcoran Blvd
- 1962 Allen St
- 55 Allen St
- 206 Treetop Ave
- 125 Manor Ct Unit 125
- 19 Manor Ct Unit 19
- 17 Skyridge Ln
- 101 Regal St
- 647 Plumtree Rd
- 0 Apple Blossom Ln
- 46 Hadley St
- 55 Old Farm Rd
Your Personal Tour Guide
Ask me questions while you tour the home.