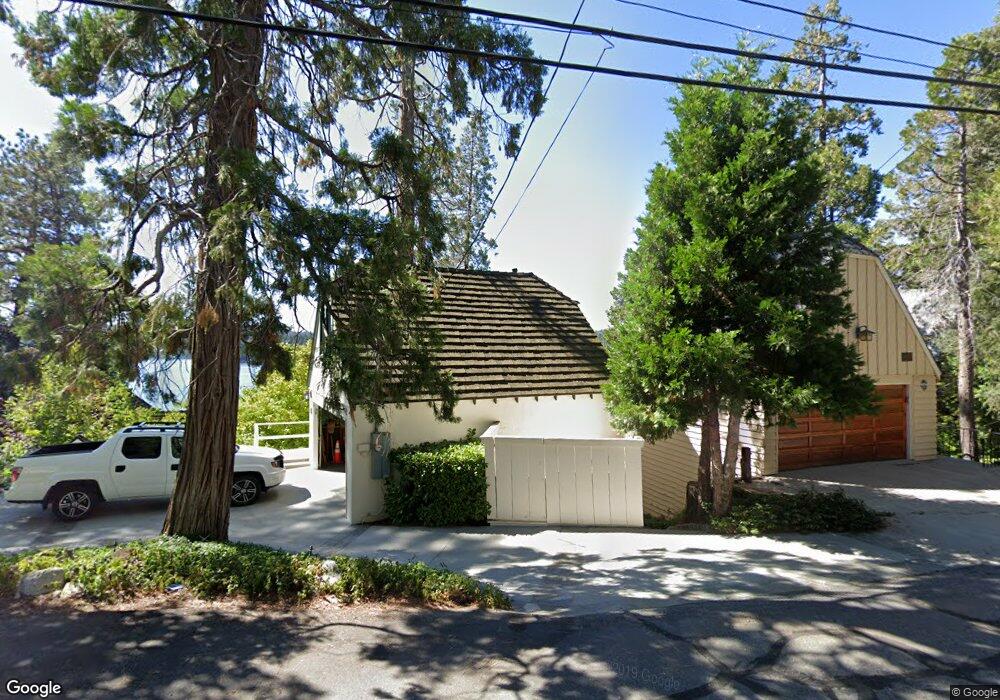
284 John Muir Rd Lake Arrowhead, CA 92352
Estimated Value: $737,000 - $1,608,000
5
Beds
3
Baths
2,419
Sq Ft
$432/Sq Ft
Est. Value
About This Home
This home is located at 284 John Muir Rd, Lake Arrowhead, CA 92352 and is currently estimated at $1,044,006, approximately $431 per square foot. 284 John Muir Rd is a home with nearby schools including Lake Arrowhead Elementary School, Mary P. Henck Intermediate School, and Rim Of The World Senior High School.
Ownership History
Date
Name
Owned For
Owner Type
Purchase Details
Closed on
Dec 31, 2012
Sold by
Hensler Bonnie Lee
Bought by
Churchill Mary L and Hensler Lake Arrowhead Trust
Current Estimated Value
Purchase Details
Closed on
Dec 30, 2011
Sold by
Churchill Mary Louise
Bought by
Hensler Bonnie Lee
Purchase Details
Closed on
May 12, 2010
Sold by
Churchill Mary Louise
Bought by
Churchill Mary Louise
Purchase Details
Closed on
Feb 19, 2010
Sold by
Hensler Bonnie Lee
Bought by
Churchill Mary L and Hensler Lake Arrowhead Trust
Purchase Details
Closed on
Dec 1, 2009
Sold by
Hensler Bonnie Lee
Bought by
Churchill Mary L and Hensler Lake Arrowhead Trust
Purchase Details
Closed on
Apr 13, 2005
Sold by
Hensler Robert Riley
Bought by
Hensler Robert Riley and Hensler Family Trust
Create a Home Valuation Report for This Property
The Home Valuation Report is an in-depth analysis detailing your home's value as well as a comparison with similar homes in the area
Home Values in the Area
Average Home Value in this Area
Purchase History
| Date | Buyer | Sale Price | Title Company |
|---|---|---|---|
| Churchill Mary L | -- | None Available | |
| Hensler Bonnie Lee | -- | None Available | |
| Hensler Bonnie Lee | -- | None Available | |
| Churchill Mary L | -- | None Available | |
| Churchill Mary Louise | -- | None Available | |
| Churchill Mary L | -- | None Available | |
| Hensler Bonnie Lee | -- | None Available | |
| Churchill Mary L | -- | None Available | |
| Hensler Bonnie Lee | -- | None Available | |
| Hensler Robert Riley | -- | -- | |
| Hensler Robert Riley | -- | -- |
Source: Public Records
Tax History Compared to Growth
Tax History
| Year | Tax Paid | Tax Assessment Tax Assessment Total Assessment is a certain percentage of the fair market value that is determined by local assessors to be the total taxable value of land and additions on the property. | Land | Improvement |
|---|---|---|---|---|
| 2025 | $2,036 | $161,675 | $61,351 | $100,324 |
| 2024 | $2,036 | $158,505 | $60,148 | $98,357 |
| 2023 | $2,015 | $155,397 | $58,969 | $96,428 |
| 2022 | $1,976 | $152,350 | $57,813 | $94,537 |
| 2021 | $1,954 | $149,362 | $56,679 | $92,683 |
| 2020 | $1,951 | $147,831 | $56,098 | $91,733 |
| 2019 | $1,907 | $144,932 | $54,998 | $89,934 |
| 2018 | $1,964 | $142,091 | $53,920 | $88,171 |
| 2017 | $1,934 | $139,305 | $52,863 | $86,442 |
| 2016 | $1,903 | $136,573 | $51,826 | $84,747 |
| 2015 | $2,462 | $134,522 | $51,048 | $83,474 |
| 2014 | $1,862 | $131,887 | $50,048 | $81,839 |
Source: Public Records
Map
Nearby Homes
- 316 John Muir Rd
- 292 Heliotrope Dr
- 0 Pine Dr Unit IV25194111
- 0 Pine Dr Unit ML82009544
- 0 Pine Dr Unit IG24242295
- 163 Bret Harte Rd
- 211 Heliotrope Dr
- 28737 Palisades Dr
- 144 Marshall Rd
- 658 Maple Dr
- 184 California 173
- 184 California 173 Unit 43
- 129 B Ln
- 28744 Palisades Dr
- 229 Maple Dr
- 419 Hemlock Dr
- 381 Maple Dr
- 0 Hook Creek Rd
- 0 Hwy 173 Unit IG25188518
- 0 State Hwy 173 Unit OC25061811
- 292 John Muir Rd
- 300 John Muir Rd
- 291 John Muir Rd
- 285 John Muir Rd
- 272 John Muir Rd
- 301 John Muir Rd
- 312 John Muir Rd
- 274 Brete Harte Rd
- 268 Bret Harte Rd
- 311 John Muir Rd
- 319 John Muir Rd
- 262 Brete Harte Rd
- 250 John Muir Rd
- 247 John Muir Rd
- 292 Bret Harte Rd
- 315 Bret Harte Rd
- 325 John Muir Rd
- 269 Brete Harte Rd
- 320 John Muir Rd
- 244 John Muir Rd