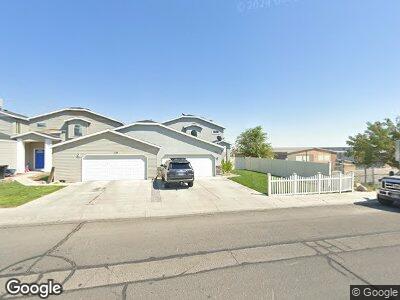
284 N Laguna Dr West Wendover, NV 89883
Estimated Value: $219,000 - $315,476
--
Bed
--
Bath
1,468
Sq Ft
$191/Sq Ft
Est. Value
About This Home
This home is located at 284 N Laguna Dr, West Wendover, NV 89883 and is currently estimated at $279,869, approximately $190 per square foot. 284 N Laguna Dr is a home with nearby schools including West Wendover Elementary School, West Wendover Junior High School, and West Wendover High School.
Ownership History
Date
Name
Owned For
Owner Type
Purchase Details
Closed on
Apr 17, 2015
Sold by
Griffin Joshua C
Bought by
Rodriguez Laurentino and Rodriguez Katarzyna M
Current Estimated Value
Home Financials for this Owner
Home Financials are based on the most recent Mortgage that was taken out on this home.
Original Mortgage
$132,554
Outstanding Balance
$103,543
Interest Rate
3.67%
Mortgage Type
FHA
Purchase Details
Closed on
Jul 23, 2009
Sold by
Griffin Sara
Bought by
Griffin Joshua C
Home Financials for this Owner
Home Financials are based on the most recent Mortgage that was taken out on this home.
Original Mortgage
$138,924
Interest Rate
5.31%
Mortgage Type
VA
Purchase Details
Closed on
Jun 1, 2009
Sold by
Dc Developers Llc
Bought by
Griffin Joshua C
Home Financials for this Owner
Home Financials are based on the most recent Mortgage that was taken out on this home.
Original Mortgage
$138,924
Interest Rate
5.31%
Mortgage Type
VA
Create a Home Valuation Report for This Property
The Home Valuation Report is an in-depth analysis detailing your home's value as well as a comparison with similar homes in the area
Home Values in the Area
Average Home Value in this Area
Purchase History
| Date | Buyer | Sale Price | Title Company |
|---|---|---|---|
| Rodriguez Laurentino | $135,000 | Stewart Title | |
| Griffin Joshua C | -- | First American Title Elko | |
| Griffin Joshua C | $136,000 | First American Title Elko |
Source: Public Records
Mortgage History
| Date | Status | Borrower | Loan Amount |
|---|---|---|---|
| Open | Rodriguez Laurentino | $132,554 | |
| Previous Owner | Griffin Joshua C | $138,924 |
Source: Public Records
Tax History Compared to Growth
Tax History
| Year | Tax Paid | Tax Assessment Tax Assessment Total Assessment is a certain percentage of the fair market value that is determined by local assessors to be the total taxable value of land and additions on the property. | Land | Improvement |
|---|---|---|---|---|
| 2024 | $2,297 | $66,319 | $10,080 | $56,239 |
| 2023 | $2,103 | $62,955 | $10,080 | $52,875 |
| 2022 | $2,041 | $54,996 | $10,080 | $44,916 |
| 2021 | $2,028 | $53,889 | $10,080 | $43,809 |
| 2020 | $2,024 | $54,478 | $10,080 | $44,398 |
| 2019 | $1,966 | $52,203 | $10,080 | $42,123 |
| 2018 | $1,975 | $52,431 | $10,080 | $42,351 |
| 2017 | $1,949 | $51,746 | $10,080 | $41,666 |
| 2016 | $1,924 | $51,491 | $10,080 | $41,411 |
| 2015 | $1,870 | $50,848 | $10,080 | $40,768 |
| 2014 | $1,743 | $48,933 | $10,080 | $38,853 |
Source: Public Records
Map
Nearby Homes
- 0 Sec 17 Twp 33n Rge 70e Mdb&m Unit 3625478
- 2051 Butte St
- 2911 Winged Foot Ct
- 0 Pueblo Blvd Unit 11071957
- 2947 Sawgrass Ct
- 0 N Butte St
- 1806 Butte St
- 1890 Pueblo Blvd
- 250 8th St
- 700 Red Cedar Way
- SEC 11b Twp 35n Rge 69e Mdb&m
- 0 Blm 1578 Rd Unit 3626010
- 0 Unit 3626136
- 401 Quaking Aspen Rd
- 0 Pine Cone Dr Unit 1 220015980
- 10 Acres Pilot Rd
- 0 Pilot Rd Unit 3625069
- 0 0 Sec 5 Twp 35n Rge 67e Mdb&m Unit 3626242
- 0 0 Sec 5 Twp 35n Rge 67e Mdb&m Unit 3626243
- 0 0 Sec 5 Twp 35n Rge 67e Mdb&m Unit 3626241