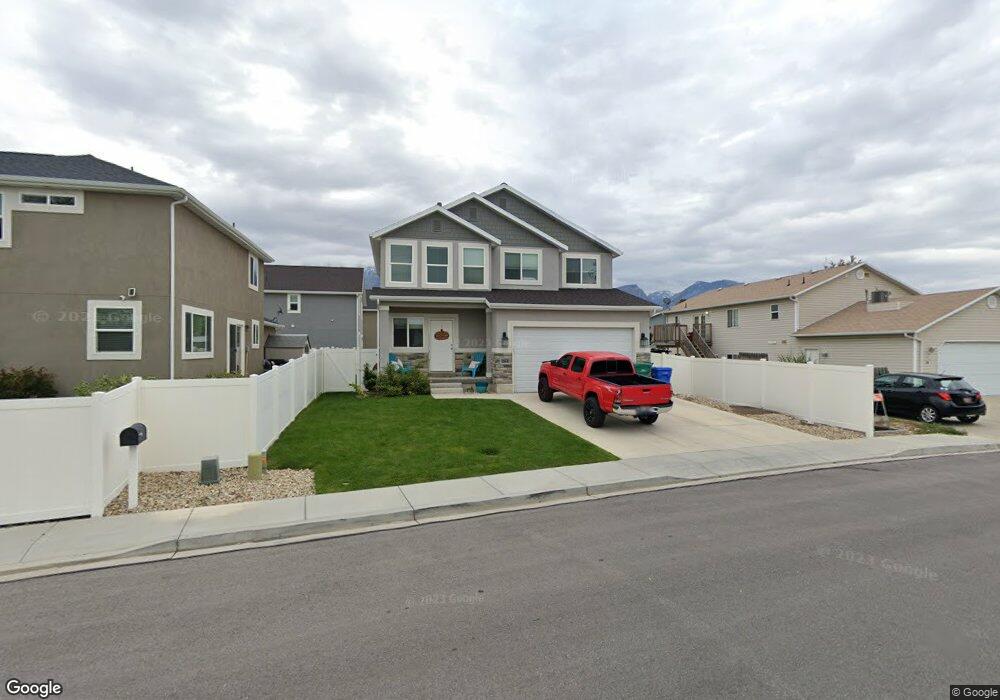
284 N Main St Orem, UT 84057
Sharon NeighborhoodEstimated Value: $527,007 - $567,000
3
Beds
3
Baths
2,446
Sq Ft
$224/Sq Ft
Est. Value
About This Home
This home is located at 284 N Main St, Orem, UT 84057 and is currently estimated at $548,002, approximately $224 per square foot. 284 N Main St is a home located in Utah County with nearby schools including Cascade Elementary School, Canyon View Junior High School, and Orem High School.
Ownership History
Date
Name
Owned For
Owner Type
Purchase Details
Closed on
Aug 18, 2016
Sold by
Millhaven Construction Llc
Bought by
Hardman Makenzie and Hardman Kadon
Current Estimated Value
Home Financials for this Owner
Home Financials are based on the most recent Mortgage that was taken out on this home.
Original Mortgage
$278,778
Outstanding Balance
$221,928
Interest Rate
3.41%
Mortgage Type
New Conventional
Estimated Equity
$326,074
Purchase Details
Closed on
Feb 24, 2016
Sold by
Skyview Developmetnt Group Llc
Bought by
Millhaven Construction Llc
Create a Home Valuation Report for This Property
The Home Valuation Report is an in-depth analysis detailing your home's value as well as a comparison with similar homes in the area
Home Values in the Area
Average Home Value in this Area
Purchase History
| Date | Buyer | Sale Price | Title Company |
|---|---|---|---|
| Hardman Makenzie | -- | Union Title | |
| Millhaven Construction Llc | -- | None Available |
Source: Public Records
Mortgage History
| Date | Status | Borrower | Loan Amount |
|---|---|---|---|
| Open | Hardman Makenzie | $278,778 |
Source: Public Records
Tax History
| Year | Tax Paid | Tax Assessment Tax Assessment Total Assessment is a certain percentage of the fair market value that is determined by local assessors to be the total taxable value of land and additions on the property. | Land | Improvement |
|---|---|---|---|---|
| 2025 | $2,060 | $267,850 | -- | -- |
| 2024 | $2,060 | $251,900 | $0 | $0 |
| 2023 | $1,930 | $253,605 | $0 | $0 |
| 2022 | $1,862 | $237,105 | $0 | $0 |
| 2021 | $1,649 | $318,000 | $118,900 | $199,100 |
| 2020 | $1,532 | $290,300 | $95,100 | $195,200 |
| 2019 | $1,426 | $281,100 | $85,900 | $195,200 |
| 2018 | $1,308 | $246,400 | $76,700 | $169,700 |
| 2017 | $1,199 | $121,000 | $0 | $0 |
| 2016 | $495 | $46,000 | $0 | $0 |
| 2015 | $523 | $46,000 | $0 | $0 |
Source: Public Records
Map
Nearby Homes
Your Personal Tour Guide
Ask me questions while you tour the home.