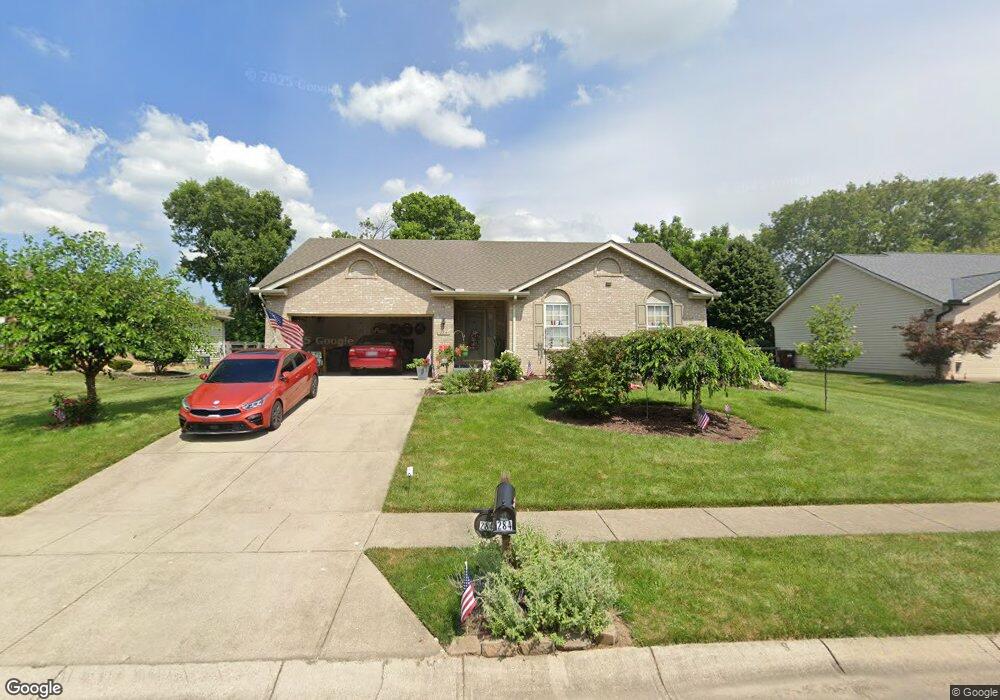
284 Stone Ridge Ln Middletown, OH 45044
Estimated Value: $298,845 - $336,000
3
Beds
2
Baths
1,358
Sq Ft
$236/Sq Ft
Est. Value
About This Home
This home is located at 284 Stone Ridge Ln, Middletown, OH 45044 and is currently estimated at $319,961, approximately $235 per square foot. 284 Stone Ridge Ln is a home located in Butler County with nearby schools including Monroe Primary School, Monroe Elementary School, and Monroe Junior High School.
Ownership History
Date
Name
Owned For
Owner Type
Purchase Details
Closed on
Oct 21, 2005
Sold by
Jones Jason and Jones Anna
Bought by
Walters Peggy A
Current Estimated Value
Purchase Details
Closed on
Nov 5, 2003
Sold by
Winchester Home Inc
Bought by
Jones Jason and Jones Anna
Home Financials for this Owner
Home Financials are based on the most recent Mortgage that was taken out on this home.
Original Mortgage
$119,900
Interest Rate
6.07%
Mortgage Type
Purchase Money Mortgage
Purchase Details
Closed on
Jan 15, 2003
Sold by
J Ii Homes Inc
Bought by
Winchester Homes
Home Financials for this Owner
Home Financials are based on the most recent Mortgage that was taken out on this home.
Original Mortgage
$22,425
Interest Rate
5.94%
Mortgage Type
Purchase Money Mortgage
Create a Home Valuation Report for This Property
The Home Valuation Report is an in-depth analysis detailing your home's value as well as a comparison with similar homes in the area
Home Values in the Area
Average Home Value in this Area
Purchase History
| Date | Buyer | Sale Price | Title Company |
|---|---|---|---|
| Walters Peggy A | $165,000 | Classic Title Agency Llc | |
| Jones Jason | $149,900 | Choice 1 Title | |
| Winchester Homes | $109,386 | Tri Star Title Agency | |
| Winchester Homes Inc | $30,000 | Tri Star Title Agency |
Source: Public Records
Mortgage History
| Date | Status | Borrower | Loan Amount |
|---|---|---|---|
| Previous Owner | Jones Jason | $119,900 | |
| Previous Owner | Winchester Homes Inc | $22,425 | |
| Previous Owner | Winchester Homes | $130,325 |
Source: Public Records
Tax History Compared to Growth
Tax History
| Year | Tax Paid | Tax Assessment Tax Assessment Total Assessment is a certain percentage of the fair market value that is determined by local assessors to be the total taxable value of land and additions on the property. | Land | Improvement |
|---|---|---|---|---|
| 2024 | $3,231 | $81,210 | $13,050 | $68,160 |
| 2023 | $3,223 | $82,190 | $13,050 | $69,140 |
| 2022 | $2,465 | $57,290 | $13,050 | $44,240 |
| 2021 | $2,375 | $57,290 | $13,050 | $44,240 |
| 2020 | $2,460 | $57,290 | $13,050 | $44,240 |
| 2019 | $3,538 | $51,600 | $13,580 | $38,020 |
| 2018 | $2,344 | $51,600 | $13,580 | $38,020 |
| 2017 | $2,394 | $51,600 | $13,580 | $38,020 |
| 2016 | $2,301 | $48,240 | $13,580 | $34,660 |
| 2015 | $2,276 | $48,240 | $13,580 | $34,660 |
| 2014 | $2,217 | $48,240 | $13,580 | $34,660 |
| 2013 | $2,217 | $47,450 | $10,860 | $36,590 |
Source: Public Records
Map
Nearby Homes
- 1952 Michelle Ln
- 6383 Todhunter Rd
- 6261 Todhunter Rd
- 27 Kameron Dr
- 401 Granny Smith Ln
- 2043 Bridgewater Ln
- 6631 Hamilton Middletown Rd
- 75 Bayberry Ln
- 176 Lakeview Dr
- 5346 Roden Park Dr
- 389 David Lee Ct
- 511 Shawn Dr
- 390 David Lee Ct
- 393 David Lee Ct
- 395 David Lee Ct
- 925 Morgan Dr
- 404 David Lee Ct
- BENNETT Plan at Estates of Monroe Crossings
- STRATTON Plan at Estates of Monroe Crossings
- PARKETTE Plan at Estates of Monroe Crossings
- 280 Stone Ridge Ln
- 288 Stone Ridge Ln
- 276 Stone Ridge Ln
- 296 Stone Ridge Ln
- 285 Stone Ridge Ln
- 279 Stone Ridge Ln
- 293 Stone Ridge Ln
- 268 Stone Ridge Ln
- 268 Stone Ridge Ln Unit Middletown
- 273 Stone Ridge Ln
- 304 Stone Ridge Ln
- 309 Stone Ridge Ln
- 265 Stone Ridge Ln
- 210 Heritage Trail Dr
- 264 Stone Ridge Ln
- 200 Heritage Trail Dr
- 220 Heritage Trail Dr
- 190 Heritage Trail Dr
- 259 Stone Ridge Ln
- 315 Stone Ridge Ln