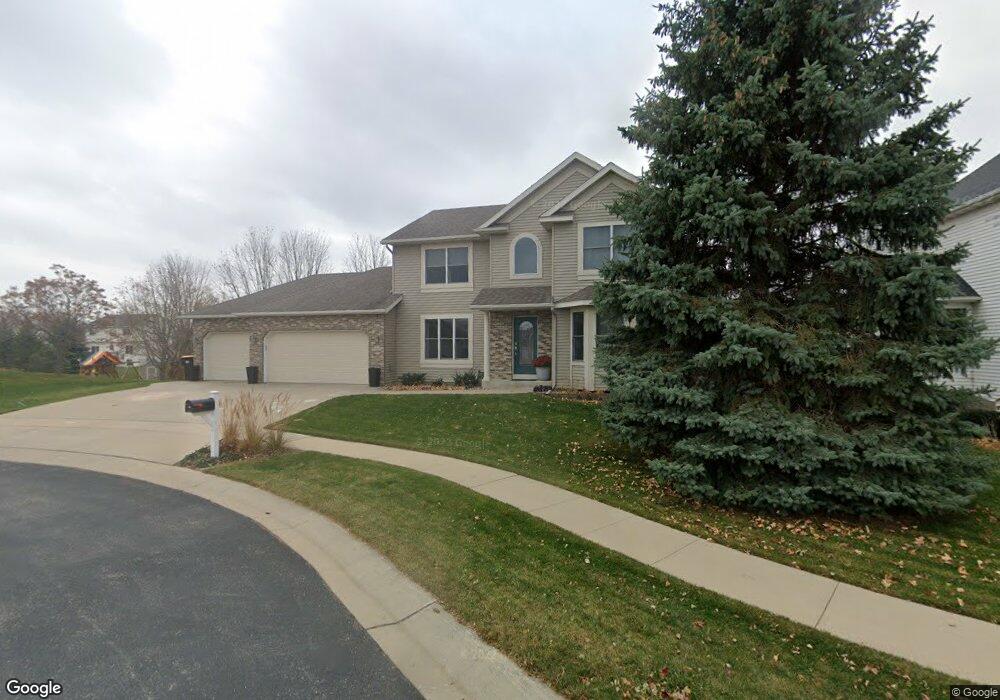
2840 Century Hills Ln NE Rochester, MN 55906
Estimated Value: $609,945 - $692,000
5
Beds
4
Baths
3,748
Sq Ft
$174/Sq Ft
Est. Value
About This Home
This home is located at 2840 Century Hills Ln NE, Rochester, MN 55906 and is currently estimated at $653,986, approximately $174 per square foot. 2840 Century Hills Ln NE is a home located in Olmsted County with nearby schools including Jefferson Elementary School, Kellogg Middle School, and Century Senior High School.
Ownership History
Date
Name
Owned For
Owner Type
Purchase Details
Closed on
Jun 19, 2017
Sold by
Labahn John and Labahn Kristen
Bought by
Bisbey Cindy C and Bisbey Scott M
Current Estimated Value
Home Financials for this Owner
Home Financials are based on the most recent Mortgage that was taken out on this home.
Original Mortgage
$314,400
Outstanding Balance
$260,940
Interest Rate
3.94%
Mortgage Type
New Conventional
Estimated Equity
$393,046
Purchase Details
Closed on
Sep 30, 2016
Sold by
Neil Daniel Arthur O
Bought by
Labahn John and Labahn Kristen
Home Financials for this Owner
Home Financials are based on the most recent Mortgage that was taken out on this home.
Original Mortgage
$302,400
Interest Rate
3.43%
Mortgage Type
New Conventional
Purchase Details
Closed on
Jul 9, 2008
Sold by
Oneil Amy Kersey
Bought by
Oneil Daniel Arthur
Create a Home Valuation Report for This Property
The Home Valuation Report is an in-depth analysis detailing your home's value as well as a comparison with similar homes in the area
Home Values in the Area
Average Home Value in this Area
Purchase History
| Date | Buyer | Sale Price | Title Company |
|---|---|---|---|
| Bisbey Cindy C | $393,000 | None Available | |
| Labahn John | $378,000 | Rochester Title & Escrow Co | |
| Oneil Daniel Arthur | -- | None Available |
Source: Public Records
Mortgage History
| Date | Status | Borrower | Loan Amount |
|---|---|---|---|
| Open | Bisbey Cindy C | $314,400 | |
| Previous Owner | Labahn John | $302,400 |
Source: Public Records
Tax History Compared to Growth
Tax History
| Year | Tax Paid | Tax Assessment Tax Assessment Total Assessment is a certain percentage of the fair market value that is determined by local assessors to be the total taxable value of land and additions on the property. | Land | Improvement |
|---|---|---|---|---|
| 2024 | $7,570 | $534,400 | $90,000 | $444,400 |
| 2023 | $6,723 | $523,500 | $70,000 | $453,500 |
| 2022 | $6,272 | $523,000 | $70,000 | $453,000 |
| 2021 | $5,842 | $455,900 | $70,000 | $385,900 |
| 2020 | $5,848 | $424,100 | $70,000 | $354,100 |
| 2019 | $5,410 | $407,600 | $70,000 | $337,600 |
| 2018 | $5,140 | $381,000 | $50,000 | $331,000 |
| 2017 | $5,082 | $365,100 | $50,000 | $315,100 |
| 2016 | $5,158 | $347,500 | $49,200 | $298,300 |
| 2015 | $4,866 | $342,700 | $49,600 | $293,100 |
| 2014 | $4,648 | $346,100 | $49,600 | $296,500 |
| 2012 | -- | $340,900 | $49,549 | $291,351 |
Source: Public Records
Map
Nearby Homes
- 3153 Century Ridge Rd NE
- 3105 Century Ridge Rd NE
- 3108 Bella Terra Ln NE
- 3180 Bella Terra Ln NE
- 3185 Bella Terra Ln NE
- 3120 Bella Terra Ln NE
- 3265 Allison Ln NE
- 3251 Century Ridge Place NE
- 2651 Century Pine Ln NE
- 1616 Century Ridge Ln NE
- 3341 Bella Terra Rd NE
- 3338 Bella Terra Rd NE
- 3357 Bella Terra Rd NE
- 3453 Bella Terra Rd NE
- 3373 Bella Terra Rd NE
- 3450 Bella Terra Rd NE
- 3533 Bella Terra Rd NE
- 3402 Bella Terra Rd NE
- 3466 Bella Terra Rd NE
- 3313 Bella Terra Rd NE
- 2834 Century Hills Ln NE
- 2846 Century Hills Ln NE
- 2965 Oakview Dr NE
- 2959 Oakview Dr NE
- 2981 Oakview Dr NE
- 2828 Century Hills Ln NE
- 2937 Oakview Dr NE
- 3007 Oakview Dr NE
- 2835 Century Hills Ln NE
- 2841 Century Hills Ln NE
- 2829 Century Hills Ln NE
- 1743 Century Valley Rd NE
- 1765 Century Valley Rd NE
- 2822 Century Hills Ln NE
- 2925 Oakview Dr NE
- 1787 Century Valley Rd NE
- 3029 Oakview Dr NE
- 2823 Century Hills Ln NE
- 2974 Oakview Dr NE
- 2960 Oakview Dr NE