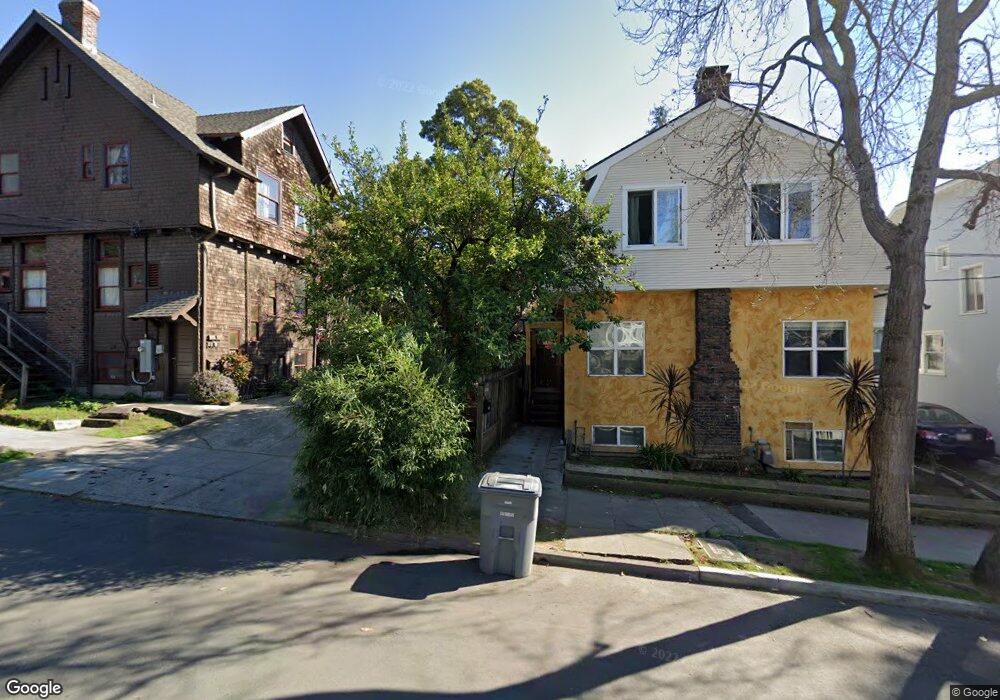
2840 Parker St Berkeley, CA 94704
Estimated Value: $1,522,000 - $1,962,000
2
Beds
2
Baths
2,164
Sq Ft
$799/Sq Ft
Est. Value
About This Home
This home is located at 2840 Parker St, Berkeley, CA 94704 and is currently estimated at $1,728,699, approximately $798 per square foot. 2840 Parker St is a home located in Alameda County with nearby schools including Emerson Elementary School, John Muir Elementary School, and Malcolm X Elementary School.
Ownership History
Date
Name
Owned For
Owner Type
Purchase Details
Closed on
Jun 5, 2003
Sold by
Sarrafan Vida
Bought by
Vafai Mohamad Hassan and Hassan Vafai M
Current Estimated Value
Home Financials for this Owner
Home Financials are based on the most recent Mortgage that was taken out on this home.
Original Mortgage
$907,000
Outstanding Balance
$352,435
Interest Rate
4.23%
Mortgage Type
Negative Amortization
Estimated Equity
$1,376,264
Purchase Details
Closed on
May 30, 2003
Sold by
Thompson David and The Susan H Thompson Trust
Bought by
Eslami A Ali and Vafai Mohamad Hassan
Home Financials for this Owner
Home Financials are based on the most recent Mortgage that was taken out on this home.
Original Mortgage
$907,000
Outstanding Balance
$352,435
Interest Rate
4.23%
Mortgage Type
Negative Amortization
Estimated Equity
$1,376,264
Purchase Details
Closed on
Nov 13, 2002
Sold by
Thompson Susan H
Bought by
Thompson David and The Susan H Thompson Trust
Create a Home Valuation Report for This Property
The Home Valuation Report is an in-depth analysis detailing your home's value as well as a comparison with similar homes in the area
Purchase History
| Date | Buyer | Sale Price | Title Company |
|---|---|---|---|
| Vafai Mohamad Hassan | -- | Placer Title Company | |
| Eslami A Ali | $575,000 | Placer Title Company | |
| Thompson David | -- | -- |
Source: Public Records
Mortgage History
| Date | Status | Borrower | Loan Amount |
|---|---|---|---|
| Open | Vafai Mohamad Hassan | $907,000 | |
| Closed | Eslami A Ali | $460,000 |
Source: Public Records
Tax History
| Year | Tax Paid | Tax Assessment Tax Assessment Total Assessment is a certain percentage of the fair market value that is determined by local assessors to be the total taxable value of land and additions on the property. | Land | Improvement |
|---|---|---|---|---|
| 2025 | $13,528 | $832,714 | $249,814 | $582,900 |
| 2024 | $13,528 | $816,390 | $244,917 | $571,473 |
| 2023 | $13,241 | $800,387 | $240,116 | $560,271 |
| 2022 | $13,494 | $784,696 | $235,409 | $549,287 |
| 2021 | $13,007 | $769,314 | $230,794 | $538,520 |
| 2020 | $12,252 | $761,431 | $228,429 | $533,002 |
| 2019 | $11,712 | $746,504 | $223,951 | $522,553 |
| 2018 | $11,506 | $731,871 | $219,561 | $512,310 |
| 2017 | $11,111 | $717,524 | $215,257 | $502,267 |
| 2016 | $10,719 | $703,460 | $211,038 | $492,422 |
| 2015 | $10,572 | $692,897 | $207,869 | $485,028 |
| 2014 | $10,485 | $679,327 | $203,798 | $475,529 |
Source: Public Records
Map
Nearby Homes
- 2614 Warring St Unit 6A
- 2632 Warring St Unit 2
- 2601 College Ave Unit 203
- 2601 College Ave Unit 208
- 2817 Palm Ct
- 2643 Stuart St
- 2 Panoramic Way Unit 105
- 2 Panoramic Way Unit 304
- 2509 Dwight Way
- 161 Panoramic Way
- 0 Panoramic Way Unit 41118724
- 39 Canyon Rd
- 190 Stonewall Rd
- 2962 Piedmont Ave
- 2702 Dana St
- 3382 Dwight Way
- 2550 Dana St Unit 2F
- 2319 Ward St
- 2800 Prince St
- 2935 Florence St
- 2812 Parker St
- 2600 Warring St
- 2608 Warring St
- 2607 Piedmont Ave
- 2601 Piedmont Ave
- 2605 Piedmont Ave
- 2610 Warring St
- 2611 Piedmont Ave Unit 2
- 2611 Piedmont Ave Unit 5
- 2611 Piedmont Ave Unit 3
- 2611 Piedmont Ave Unit 1
- 2805 Parker St
- 2803 Parker St Unit 3
- 2803 Parker St Unit 2
- 2803 Parker St Unit 1
- 2811 Parker St
- 2813 Parker St
- 2614 Warring St Unit 8
- 2614 Warring St Unit 9
- 2614 Warring St Unit 2
Your Personal Tour Guide
Ask me questions while you tour the home.