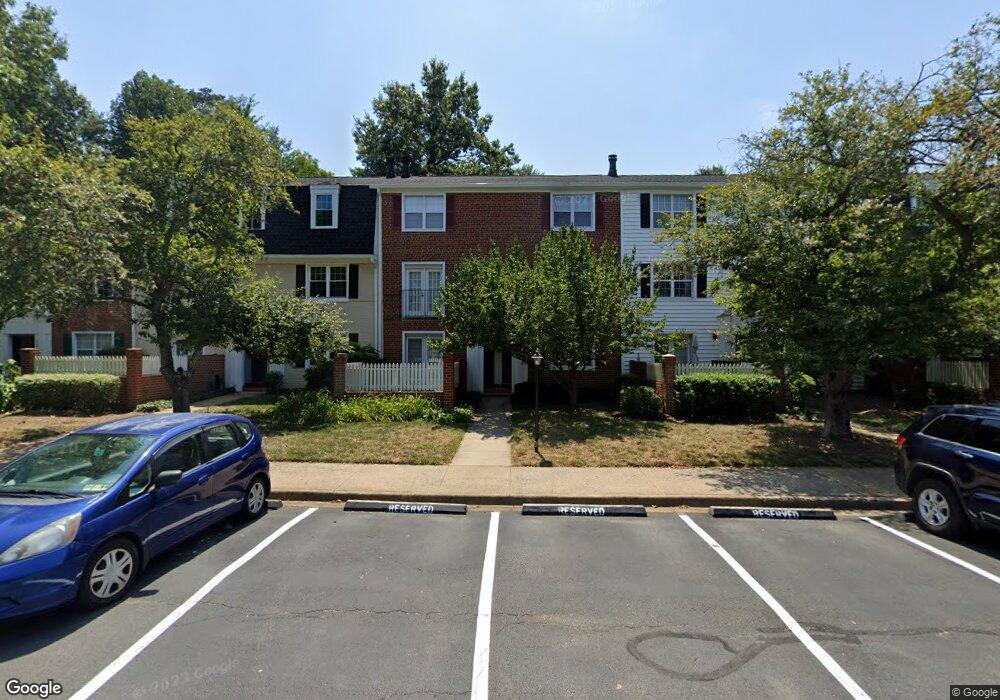
2840 S Wakefield St Unit C Arlington, VA 22206
Fairlington NeighborhoodEstimated Value: $413,000 - $458,000
2
Beds
1
Bath
875
Sq Ft
$489/Sq Ft
Est. Value
About This Home
This home is located at 2840 S Wakefield St Unit C, Arlington, VA 22206 and is currently estimated at $427,572, approximately $488 per square foot. 2840 S Wakefield St Unit C is a home located in Arlington County with nearby schools including Gunston Middle School, Wakefield High School, and Guidepost Montessori at West Alex.
Ownership History
Date
Name
Owned For
Owner Type
Purchase Details
Closed on
May 12, 2023
Sold by
Melvin Michelle P
Bought by
Vick Hannah
Current Estimated Value
Home Financials for this Owner
Home Financials are based on the most recent Mortgage that was taken out on this home.
Original Mortgage
$369,000
Outstanding Balance
$358,532
Interest Rate
6.28%
Mortgage Type
New Conventional
Estimated Equity
$69,040
Purchase Details
Closed on
Aug 17, 2022
Sold by
Melvin Steven M
Bought by
Melvin Michelle P
Purchase Details
Closed on
Jul 3, 2017
Sold by
Gregory Gallagher Donna J
Bought by
Melvin Steven M
Home Financials for this Owner
Home Financials are based on the most recent Mortgage that was taken out on this home.
Original Mortgage
$285,000
Interest Rate
3.95%
Mortgage Type
Purchase Money Mortgage
Create a Home Valuation Report for This Property
The Home Valuation Report is an in-depth analysis detailing your home's value as well as a comparison with similar homes in the area
Home Values in the Area
Average Home Value in this Area
Purchase History
| Date | Buyer | Sale Price | Title Company |
|---|---|---|---|
| Vick Hannah | $410,000 | Psr Title | |
| Melvin Michelle P | -- | -- | |
| Melvin Steven M | $300,000 | Chicago Title Insurance Co |
Source: Public Records
Mortgage History
| Date | Status | Borrower | Loan Amount |
|---|---|---|---|
| Open | Vick Hannah | $369,000 | |
| Previous Owner | Melvin Steven M | $285,000 |
Source: Public Records
Tax History Compared to Growth
Tax History
| Year | Tax Paid | Tax Assessment Tax Assessment Total Assessment is a certain percentage of the fair market value that is determined by local assessors to be the total taxable value of land and additions on the property. | Land | Improvement |
|---|---|---|---|---|
| 2025 | $4,101 | $397,000 | $67,400 | $329,600 |
| 2024 | $4,067 | $393,700 | $67,400 | $326,300 |
| 2023 | $3,989 | $387,300 | $67,400 | $319,900 |
| 2022 | $3,862 | $375,000 | $67,400 | $307,600 |
| 2021 | $3,801 | $369,000 | $67,400 | $301,600 |
| 2020 | $3,557 | $346,700 | $45,500 | $301,200 |
| 2019 | $3,226 | $314,400 | $45,500 | $268,900 |
| 2018 | $3,034 | $301,600 | $45,500 | $256,100 |
| 2017 | $2,911 | $289,400 | $45,500 | $243,900 |
| 2016 | $2,917 | $294,400 | $45,500 | $248,900 |
| 2015 | $2,983 | $299,500 | $45,500 | $254,000 |
| 2014 | $2,933 | $294,500 | $45,500 | $249,000 |
Source: Public Records
Map
Nearby Homes
- 2833 S Wakefield St Unit C
- 2905 S Woodstock St Unit C
- 4614 28th Rd S Unit B
- 2907 S Woodley St Unit C
- 4619 28th Rd S Unit C
- 4617 28th Rd S Unit B
- 2505 S Walter Reed Dr Unit A
- 4519 28th Rd S Unit A
- 2921 A S Woodley St Unit 1
- 2592 G S Arlington Mill Dr Unit 7
- 2540 S Walter Reed Dr Unit 4
- 4600 30th Rd S
- 2605 S Walter Reed Dr Unit A
- 2246 S Randolph St Unit 1
- 4836 29th St S Unit A1
- 3080 S Abingdon St Unit A1
- 3049 S Buchanan St Unit B2
- 2720 S Arlington Mill Dr Unit 1107
- 2720 S Arlington Mill Dr Unit 914
- 2949 S Columbus St Unit A2
- 2842 S Wakefield St Unit C
- 2842 S Wakefield St Unit B
- 2842 S Wakefield St Unit A
- 2842 C S Wakefield St
- 2842 C S Wakefield St Unit C
- 2836 S Wakefield Street C Unit C
- 2836 Wakefield Street B Unit B
- 2840 S Wakefield St Unit B
- 2840 S Wakefield St Unit A
- 2840 S Wakefield St Unit B
- 2840 C S Wakefield St Unit C
- 2844 Wakefield Street B S Unit B
- 2844 S Wakefield St Unit A
- 2844 S Wakefield St Unit B
- 2844 S Wakefield St Unit C
- 2844 B S Wakefield St Unit B
- 2844 S Wakefield St
- 2844 S Wakefield St Unit B
- 2844 S Wakefield St Unit C
- 2844 S Wakefield St Unit A