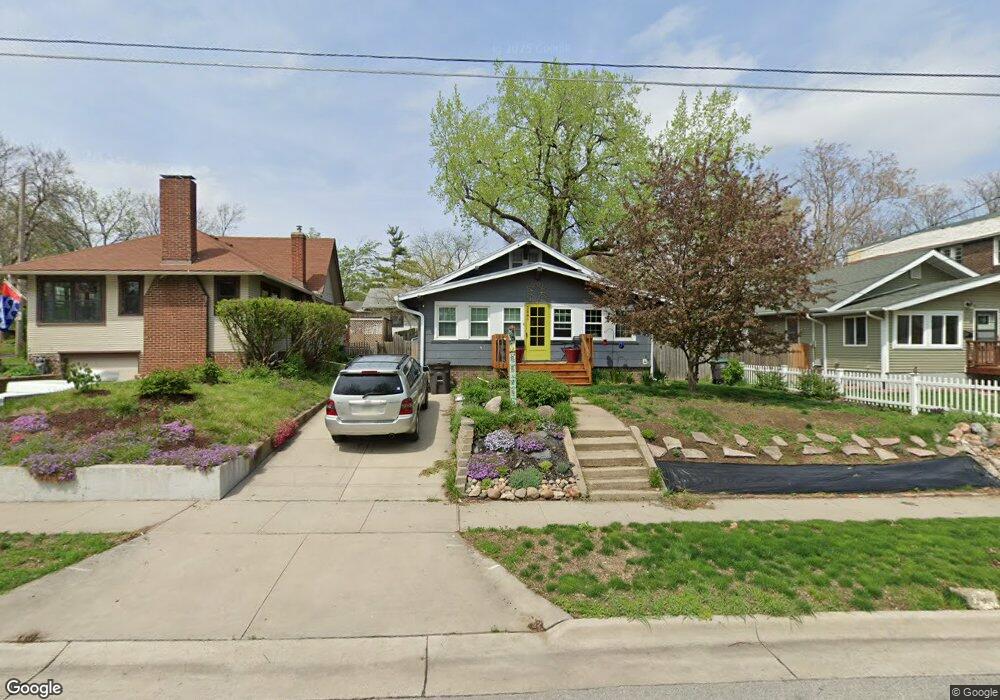
2841 Center St Des Moines, IA 50312
Woodland Heights NeighborhoodEstimated Value: $214,000 - $245,113
3
Beds
1
Bath
1,484
Sq Ft
$158/Sq Ft
Est. Value
About This Home
This home is located at 2841 Center St, Des Moines, IA 50312 and is currently estimated at $234,778, approximately $158 per square foot. 2841 Center St is a home located in Polk County with nearby schools including Greenwood Elementary School and Roosevelt High School.
Ownership History
Date
Name
Owned For
Owner Type
Purchase Details
Closed on
Jun 10, 2005
Sold by
Hennessey Jason P and Hennessey Jennifer
Bought by
Volker Anne M
Current Estimated Value
Home Financials for this Owner
Home Financials are based on the most recent Mortgage that was taken out on this home.
Original Mortgage
$108,000
Outstanding Balance
$56,240
Interest Rate
5.82%
Mortgage Type
Fannie Mae Freddie Mac
Estimated Equity
$178,539
Purchase Details
Closed on
Nov 24, 2002
Sold by
Lacy Ramona K and Ribble Bruce
Bought by
Hennessey Jason P
Home Financials for this Owner
Home Financials are based on the most recent Mortgage that was taken out on this home.
Original Mortgage
$73,600
Interest Rate
6.3%
Purchase Details
Closed on
Jun 20, 1997
Sold by
Federal National Mortgage Association
Bought by
Lacy Ramona K
Home Financials for this Owner
Home Financials are based on the most recent Mortgage that was taken out on this home.
Original Mortgage
$43,250
Interest Rate
8.01%
Purchase Details
Closed on
Mar 21, 1997
Sold by
Rice Bob E and Billick Keith J
Bought by
Federal National Mortgage Association
Create a Home Valuation Report for This Property
The Home Valuation Report is an in-depth analysis detailing your home's value as well as a comparison with similar homes in the area
Home Values in the Area
Average Home Value in this Area
Purchase History
| Date | Buyer | Sale Price | Title Company |
|---|---|---|---|
| Volker Anne M | $107,500 | -- | |
| Hennessey Jason P | $91,500 | -- | |
| Lacy Ramona K | -- | -- | |
| Federal National Mortgage Association | $44,943 | -- |
Source: Public Records
Mortgage History
| Date | Status | Borrower | Loan Amount |
|---|---|---|---|
| Open | Volker Anne M | $108,000 | |
| Previous Owner | Hennessey Jason P | $73,600 | |
| Previous Owner | Lacy Ramona K | $43,250 | |
| Closed | Hennessey Jason P | $18,400 |
Source: Public Records
Tax History Compared to Growth
Tax History
| Year | Tax Paid | Tax Assessment Tax Assessment Total Assessment is a certain percentage of the fair market value that is determined by local assessors to be the total taxable value of land and additions on the property. | Land | Improvement |
|---|---|---|---|---|
| 2025 | $4,256 | $237,400 | $40,100 | $197,300 |
| 2024 | $4,256 | $226,800 | $38,200 | $188,600 |
| 2023 | $4,038 | $226,800 | $38,200 | $188,600 |
| 2022 | $4,006 | $180,200 | $31,600 | $148,600 |
| 2021 | $3,796 | $180,200 | $31,600 | $148,600 |
| 2020 | $3,938 | $160,700 | $28,400 | $132,300 |
| 2019 | $3,674 | $160,700 | $28,400 | $132,300 |
| 2018 | $3,630 | $145,200 | $25,400 | $119,800 |
| 2017 | $3,304 | $145,200 | $25,400 | $119,800 |
| 2016 | $3,214 | $130,700 | $22,800 | $107,900 |
| 2015 | $3,214 | $130,700 | $22,800 | $107,900 |
| 2014 | $2,726 | $111,300 | $19,300 | $92,000 |
Source: Public Records
Map
Nearby Homes