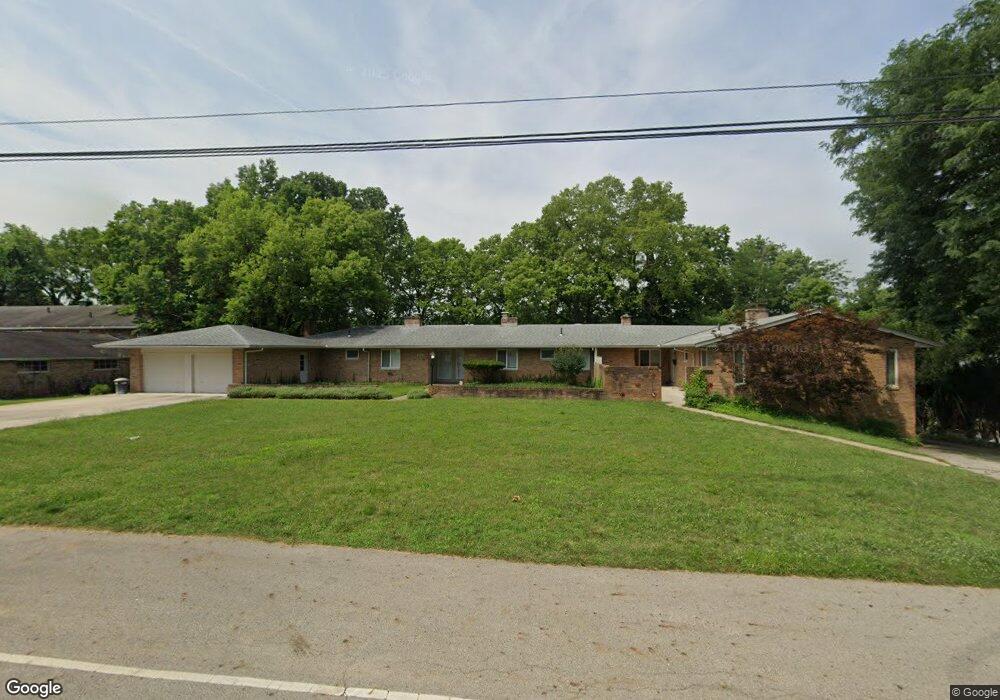
2841 Charing Rd Unit 845 Columbus, OH 43221
Estimated Value: $717,000 - $765,721
6
Beds
4
Baths
3,731
Sq Ft
$200/Sq Ft
Est. Value
About This Home
This home is located at 2841 Charing Rd Unit 845, Columbus, OH 43221 and is currently estimated at $745,240, approximately $199 per square foot. 2841 Charing Rd Unit 845 is a home located in Franklin County with nearby schools including Tremont Elementary School, Jones Middle School, and Upper Arlington High School.
Ownership History
Date
Name
Owned For
Owner Type
Purchase Details
Closed on
Jul 13, 2021
Sold by
Mf Arlington Properties Llc
Bought by
Rehm Aaron Matthew
Current Estimated Value
Home Financials for this Owner
Home Financials are based on the most recent Mortgage that was taken out on this home.
Original Mortgage
$472,500
Outstanding Balance
$425,685
Interest Rate
3%
Mortgage Type
New Conventional
Estimated Equity
$319,555
Purchase Details
Closed on
Feb 16, 2016
Sold by
Porter Sherlyn
Bought by
Hinkle Ii G Franklin and Federer Mark A
Home Financials for this Owner
Home Financials are based on the most recent Mortgage that was taken out on this home.
Original Mortgage
$300,000
Interest Rate
3.81%
Mortgage Type
Credit Line Revolving
Purchase Details
Closed on
Jan 7, 1966
Bought by
Porter Betty E
Create a Home Valuation Report for This Property
The Home Valuation Report is an in-depth analysis detailing your home's value as well as a comparison with similar homes in the area
Home Values in the Area
Average Home Value in this Area
Purchase History
| Date | Buyer | Sale Price | Title Company |
|---|---|---|---|
| Rehm Aaron Matthew | $635,000 | Valley Title & Escrow | |
| Hinkle Ii G Franklin | $375,000 | Commerce Park Title Agency L | |
| Porter Betty E | -- | -- |
Source: Public Records
Mortgage History
| Date | Status | Borrower | Loan Amount |
|---|---|---|---|
| Open | Rehm Aaron Matthew | $472,500 | |
| Previous Owner | Hinkle Ii G Franklin | $300,000 |
Source: Public Records
Tax History
| Year | Tax Paid | Tax Assessment Tax Assessment Total Assessment is a certain percentage of the fair market value that is determined by local assessors to be the total taxable value of land and additions on the property. | Land | Improvement |
|---|---|---|---|---|
| 2025 | $13,878 | $236,670 | $86,240 | $150,430 |
| 2024 | $13,878 | $236,670 | $86,240 | $150,430 |
| 2023 | $13,708 | $236,670 | $86,240 | $150,430 |
| 2022 | $15,882 | $222,260 | $92,230 | $130,030 |
| 2021 | $10,557 | $166,890 | $92,230 | $74,660 |
| 2020 | $10,466 | $166,890 | $92,230 | $74,660 |
| 2019 | $10,780 | $151,940 | $92,230 | $59,710 |
| 2018 | $9,048 | $130,240 | $92,230 | $38,010 |
| 2017 | $9,173 | $130,240 | $92,230 | $38,010 |
| 2016 | $8,912 | $131,250 | $68,670 | $62,580 |
| 2015 | $8,904 | $131,250 | $68,670 | $62,580 |
| 2014 | $10,068 | $148,230 | $68,670 | $79,560 |
| 2013 | $4,807 | $134,750 | $62,440 | $72,310 |
Source: Public Records
Map
Nearby Homes
- 2837 Canterbury Ln
- 2824 Chateau Cir S Unit 86
- 2861 Chateau Cir Unit 22
- 2559 Olde Hill Ct S Unit A2559
- 3163 S Dorchester Rd
- 2380 Quarry Trails Dr
- 2424 Quarry Trails Dr
- 2512 Quarry Trails Dr
- 2456 Quarry Trails Dr
- 2729 Eastcleft Dr
- 3134 Herrick Rd
- 2502 Quarry Trails Dr
- 3231 Stonecrest Ct Unit 40
- 2464 Quarry Trails Dr
- 2448 Quarry Trails Dr
- 2432 Quarry Trails Dr
- 2827 Katmai Dr
- 2833 Katmai Dr
- 2845 Katmai Dr
- 2851 Katmai Dr
- 2841 Charing Rd Unit 2845
- 2857 Charing Rd
- 2859 Charing Rd
- 2867 Charing Rd
- 2869 Charing Rd Unit 2869
- 2881 Charing Rd Unit 885
- 2815 Charing Rd Unit 2815
- 2860 Charing Rd
- 2883 Charing Rd Unit 2883
- 2811 Charing Rd Unit 2811
- 2840 Charing Rd
- 2821 Canterbury Rd
- 2803 Charing Rd Unit 805
- 2891 Charing Rd
- 2891 Charing Rd Unit No
- 2895 Charing Rd Unit 22895
- 2893 Charing Rd Unit 3
- 2897 Charing Rd
- 2831 Margate Rd
- 2820 Margate Rd
Your Personal Tour Guide
Ask me questions while you tour the home.