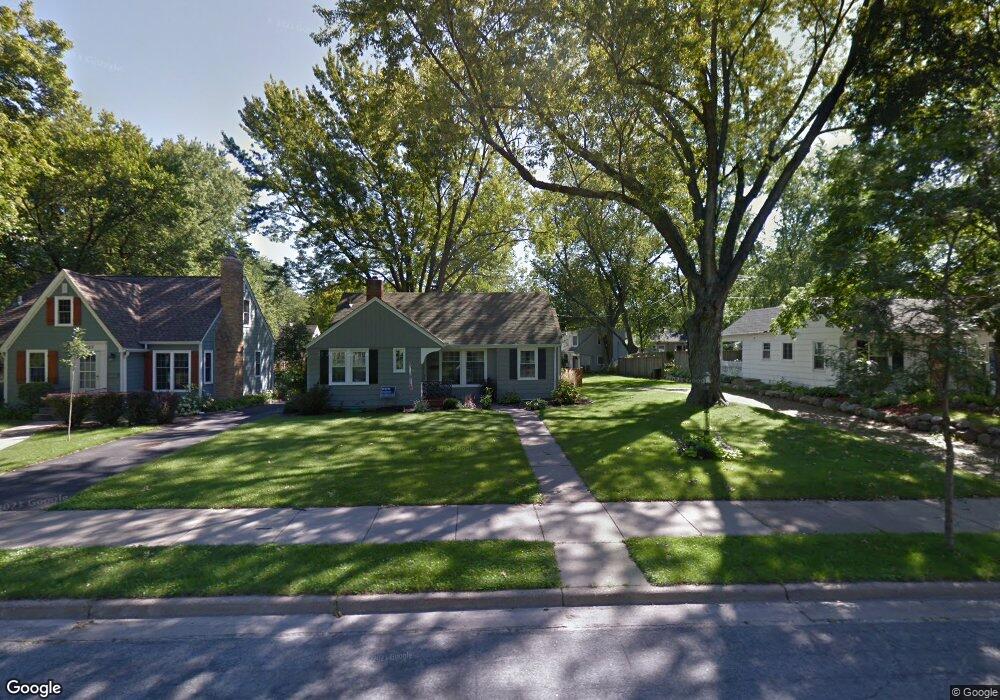
2841 Quentin Ave Saint Louis Park, MN 55416
Fern Hill NeighborhoodEstimated Value: $517,000 - $671,000
4
Beds
2
Baths
1,058
Sq Ft
$558/Sq Ft
Est. Value
About This Home
This home is located at 2841 Quentin Ave, Saint Louis Park, MN 55416 and is currently estimated at $590,849, approximately $558 per square foot. 2841 Quentin Ave is a home located in Hennepin County with nearby schools including Susan Lindgren Elementary School, St. Louis Park Middle School, and St. Louis Park High School.
Ownership History
Date
Name
Owned For
Owner Type
Purchase Details
Closed on
Aug 10, 2012
Sold by
Peschel Daniel and Peschel Michelle
Bought by
Westlund Andrew Ryan and Bronniche Jessica
Current Estimated Value
Home Financials for this Owner
Home Financials are based on the most recent Mortgage that was taken out on this home.
Original Mortgage
$293,500
Outstanding Balance
$199,264
Interest Rate
3.25%
Mortgage Type
FHA
Estimated Equity
$391,585
Purchase Details
Closed on
May 16, 2008
Sold by
Hanson Jessica
Bought by
Peschel Davel and Peschel Michelle
Purchase Details
Closed on
Mar 16, 2007
Sold by
Anthony Construction Inc
Bought by
Hanson Jessica
Purchase Details
Closed on
Jul 11, 2006
Sold by
Shaw Elizabeth
Bought by
Anthony Construction
Purchase Details
Closed on
Jun 11, 1998
Sold by
Estate Of Earl J Johnson
Bought by
Shaw James M and Shaw Elizabeth S
Create a Home Valuation Report for This Property
The Home Valuation Report is an in-depth analysis detailing your home's value as well as a comparison with similar homes in the area
Home Values in the Area
Average Home Value in this Area
Purchase History
| Date | Buyer | Sale Price | Title Company |
|---|---|---|---|
| Westlund Andrew Ryan | $299,000 | Minnetonka Title Inc | |
| Peschel Davel | $320,900 | -- | |
| Hanson Jessica | $283,500 | -- | |
| Anthony Construction | $253,000 | -- | |
| Shaw James M | $135,000 | -- |
Source: Public Records
Mortgage History
| Date | Status | Borrower | Loan Amount |
|---|---|---|---|
| Open | Westlund Andrew Ryan | $293,500 |
Source: Public Records
Tax History Compared to Growth
Tax History
| Year | Tax Paid | Tax Assessment Tax Assessment Total Assessment is a certain percentage of the fair market value that is determined by local assessors to be the total taxable value of land and additions on the property. | Land | Improvement |
|---|---|---|---|---|
| 2024 | $7,850 | $548,500 | $274,400 | $274,100 |
| 2023 | $5,519 | $414,100 | $273,100 | $141,000 |
| 2022 | $5,117 | $416,700 | $260,100 | $156,600 |
| 2021 | $4,746 | $384,400 | $226,200 | $158,200 |
| 2020 | $4,812 | $361,900 | $215,500 | $146,400 |
| 2019 | $4,771 | $352,900 | $213,400 | $139,500 |
| 2018 | $4,609 | $338,800 | $203,300 | $135,500 |
| 2017 | $4,375 | $312,100 | $160,800 | $151,300 |
| 2016 | $4,380 | $302,100 | $152,000 | $150,100 |
| 2015 | $4,353 | $292,200 | $142,100 | $150,100 |
| 2014 | -- | $284,100 | $134,700 | $149,400 |
Source: Public Records
Map
Nearby Homes
- 2930 Salem Ave
- 2744 Toledo Ave S
- 2936 Monterey Ave S
- 4625 Minnetonka Blvd Unit 105
- 2910 Vernon Ave S
- 3005 Monterey Ave
- 2955 Yosemite Ave S
- 3201 Xenwood Ave S
- 2653 Joppa Ave S
- 2656 Xenwood Ave S
- 2724 Yosemite Ave S
- 2960 Zarthan Ave S
- 4100 Sunset Blvd
- 3106 Zarthan Ave S
- 2833 Alabama Ave S
- 2648 Yosemite Ave S
- 2633 Zarthan Ave S
- 2921 Blackstone Ave
- 4013 W 31st St Unit 102
- 2644 Zarthan Ave S Unit 20
- 2837 Quentin Ave
- 2837 Quentin Ave
- 2837 Quentin Ave
- 2847 Quentin Ave
- 2841 2841 Quentin-Avenue-s
- 2831 Quentin Ave
- 2832 2832 Quentin Ave S
- 2832 2832 Quentin-Avenue-
- 2847 2847 Quentin Ave
- 2853 Quentin Ave
- 2840 Princeton Ave
- 2846 Princeton Ave
- 2834 Princeton Ave
- 2827 Quentin Ave
- 2850 Princeton Ave
- 2830 Princeton Ave
- 2856 Princeton Ave
- 2838 Quentin Ave
- 2844 Quentin Ave
- 2856 Princeton Ave