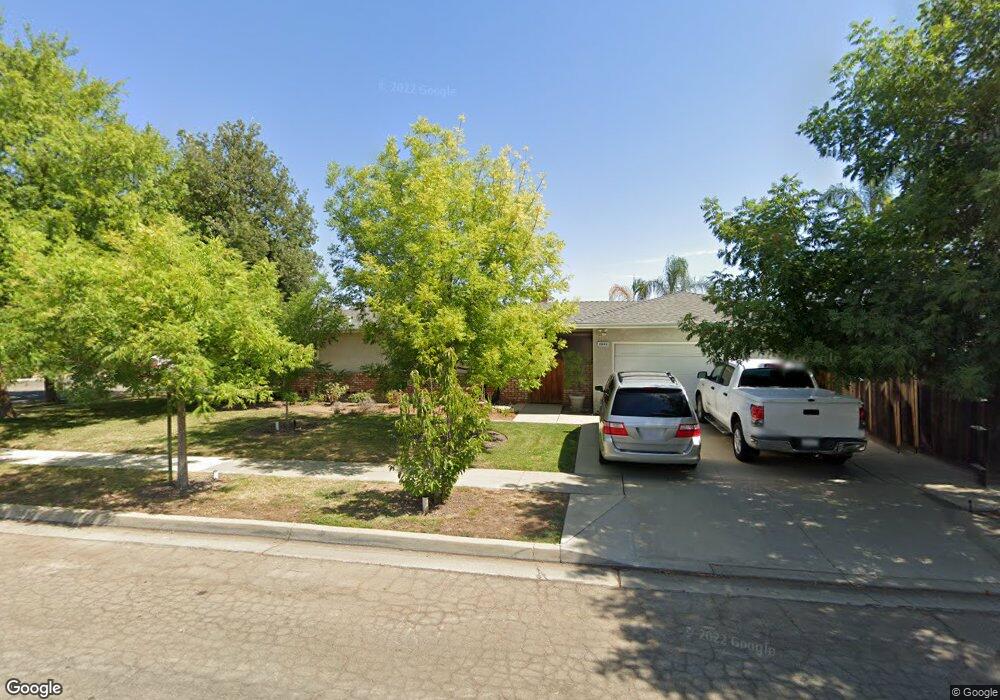
2842 E Los Altos Ave Fresno, CA 93710
Hoover NeighborhoodEstimated Value: $457,000 - $473,000
3
Beds
2
Baths
1,852
Sq Ft
$251/Sq Ft
Est. Value
About This Home
This home is located at 2842 E Los Altos Ave, Fresno, CA 93710 and is currently estimated at $464,294, approximately $250 per square foot. 2842 E Los Altos Ave is a home located in Fresno County with nearby schools including Eaton Elementary School, Ahwahnee Middle School, and Herbert Hoover High School.
Ownership History
Date
Name
Owned For
Owner Type
Purchase Details
Closed on
May 12, 2004
Sold by
Thompson Patrick Wayne and Thompson Cindy Cherre
Bought by
Filla Daniel and Mccurry Filla Helga
Current Estimated Value
Home Financials for this Owner
Home Financials are based on the most recent Mortgage that was taken out on this home.
Original Mortgage
$192,500
Outstanding Balance
$89,429
Interest Rate
5.37%
Mortgage Type
Purchase Money Mortgage
Estimated Equity
$374,865
Purchase Details
Closed on
Aug 18, 2000
Sold by
Wayne Thompson Patrick
Bought by
Thompson Patrick Wayne and Thompson Cindy Cherre
Purchase Details
Closed on
Oct 1, 1997
Sold by
Cornwell Frank E and Cornwell Donna J
Bought by
Thompson Patrick Wayne
Home Financials for this Owner
Home Financials are based on the most recent Mortgage that was taken out on this home.
Original Mortgage
$99,750
Interest Rate
7.3%
Create a Home Valuation Report for This Property
The Home Valuation Report is an in-depth analysis detailing your home's value as well as a comparison with similar homes in the area
Home Values in the Area
Average Home Value in this Area
Purchase History
| Date | Buyer | Sale Price | Title Company |
|---|---|---|---|
| Filla Daniel | $275,000 | First American Title Ins Co | |
| Thompson Patrick Wayne | -- | -- | |
| Thompson Patrick Wayne | $105,000 | First American Title Ins Co |
Source: Public Records
Mortgage History
| Date | Status | Borrower | Loan Amount |
|---|---|---|---|
| Open | Filla Daniel | $192,500 | |
| Previous Owner | Thompson Patrick Wayne | $99,750 | |
| Closed | Filla Daniel | $55,000 |
Source: Public Records
Tax History Compared to Growth
Tax History
| Year | Tax Paid | Tax Assessment Tax Assessment Total Assessment is a certain percentage of the fair market value that is determined by local assessors to be the total taxable value of land and additions on the property. | Land | Improvement |
|---|---|---|---|---|
| 2025 | $4,795 | $390,971 | $62,546 | $328,425 |
| 2023 | $4,701 | $375,791 | $60,118 | $315,673 |
| 2022 | $4,635 | $368,424 | $58,940 | $309,484 |
| 2021 | $4,340 | $348,000 | $55,200 | $292,800 |
| 2020 | $3,963 | $316,400 | $50,200 | $266,200 |
| 2019 | $3,718 | $302,900 | $48,100 | $254,800 |
| 2018 | $3,600 | $294,100 | $46,700 | $247,400 |
| 2017 | $3,402 | $277,500 | $44,100 | $233,400 |
| 2016 | $3,192 | $264,300 | $42,000 | $222,300 |
| 2015 | $3,024 | $250,700 | $39,900 | $210,800 |
| 2014 | $2,831 | $234,800 | $37,400 | $197,400 |
Source: Public Records
Map
Nearby Homes
- 2870 E Tierra Dr
- 2882 E Tierra Dr
- 2894 E Tierra Dr
- 2942 E Tierra Dr
- 2954 Tierra Dr
- 2728 E Sierra Ave
- 6776 N Woodrow Ave
- 6660 N Winery Ave
- 6583 N Maple Ave
- 2625 E Sean Ave
- 2669 E Sean Ave
- 0 Willow Bluff Unit 638378
- 2550 E Jenny Ave
- 150 N Anderson Ave
- 2051 E Fremont Ave
- 493 Timmy Ave
- 194 Cindy Ave
- 2658 E Alluvial Ave Unit 220
- 1831 E Chennault Ave
- 563 N Chapel Hill Ln
- 2834 E Los Altos Ave
- 6625 N Dearing Ave
- 6637 N Dearing Ave
- 6651 N Dearing Ave
- 2835 E Los Altos Ave
- 2826 E Los Altos Ave
- 2825 E Los Altos Ave
- 2847 E Los Altos Ave
- 2810 E Los Altos Ave
- 6663 N Dearing Ave
- 2817 E Los Altos Ave
- 2857 E Los Altos Ave
- 2818 E Los Altos Ave
- 2847 E Palo Alto Ave
- 2809 E Los Altos Ave
- 2849 E Palo Alto Ave
- 2877 E Los Altos Ave
- 2837 E Palo Alto Ave
- 6630 N Dearing Ave
- 2871 E Palo Alto Ave