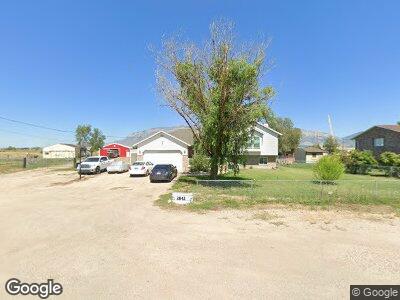
2842 W Pioneer Rd Ogden, UT 84404
Marriott-Slaterville NeighborhoodEstimated Value: $555,000 - $689,362
4
Beds
4
Baths
2,146
Sq Ft
$292/Sq Ft
Est. Value
About This Home
This home is located at 2842 W Pioneer Rd, Ogden, UT 84404 and is currently estimated at $627,341, approximately $292 per square foot. 2842 W Pioneer Rd is a home located in Weber County with nearby schools including West Weber School, Wahlquist Junior High School, and Fremont High School.
Ownership History
Date
Name
Owned For
Owner Type
Purchase Details
Closed on
Mar 30, 2022
Sold by
Miller David A and Miller Jodi D
Bought by
Sierra Cristina and Angel Raul G
Current Estimated Value
Purchase Details
Closed on
Mar 22, 2013
Sold by
Miller David Andrew and Miller Jodi
Bought by
Miller David A and Miller Jodi D
Home Financials for this Owner
Home Financials are based on the most recent Mortgage that was taken out on this home.
Original Mortgage
$187,000
Interest Rate
3.49%
Mortgage Type
New Conventional
Purchase Details
Closed on
Jan 26, 2004
Sold by
Green Mark W and Green Lori L
Bought by
Miller David Andrew and Miller Jodi
Create a Home Valuation Report for This Property
The Home Valuation Report is an in-depth analysis detailing your home's value as well as a comparison with similar homes in the area
Home Values in the Area
Average Home Value in this Area
Purchase History
| Date | Buyer | Sale Price | Title Company |
|---|---|---|---|
| Sierra Cristina | -- | First American Title | |
| Miller David A | -- | Bonneville Superior Title Co | |
| Miller David Andrew | -- | Backman Stewart Title |
Source: Public Records
Mortgage History
| Date | Status | Borrower | Loan Amount |
|---|---|---|---|
| Previous Owner | Miller David A | $206,848 | |
| Previous Owner | Miller David A | $187,000 | |
| Previous Owner | Miller David Andrew | $16,500 | |
| Previous Owner | Miller David Andrew | $194,000 | |
| Previous Owner | Miller David Andrew | $189,500 | |
| Previous Owner | Miller David | $26,500 | |
| Previous Owner | Miller David Andrew | $160,000 | |
| Previous Owner | Miller David Andrew | $152,453 |
Source: Public Records
Tax History Compared to Growth
Tax History
| Year | Tax Paid | Tax Assessment Tax Assessment Total Assessment is a certain percentage of the fair market value that is determined by local assessors to be the total taxable value of land and additions on the property. | Land | Improvement |
|---|---|---|---|---|
| 2024 | $3,795 | $405,553 | $155,305 | $250,248 |
| 2023 | $3,888 | $410,343 | $148,948 | $261,395 |
| 2022 | $3,036 | $311,850 | $121,960 | $189,890 |
| 2021 | $2,519 | $431,999 | $136,782 | $295,217 |
| 2020 | $2,332 | $368,999 | $85,423 | $283,576 |
| 2019 | $2,231 | $332,000 | $75,400 | $256,600 |
| 2018 | $2,023 | $285,999 | $75,400 | $210,599 |
| 2017 | $1,654 | $228,998 | $59,076 | $169,922 |
| 2016 | $1,474 | $118,533 | $41,070 | $77,463 |
| 2015 | $1,592 | $126,658 | $41,070 | $85,588 |
| 2014 | $1,520 | $118,224 | $43,800 | $74,424 |
Source: Public Records
Map
Nearby Homes
- 2069 W 1575 N Unit 130
- 2073 W 1575 N Unit 129
- 1111 N 2000 W Unit 295
- 1111 N 2000 W Unit 27
- 1111 N 2000 W Unit 217
- 1111 N 2000 W Unit 245
- 1111 N 2000 W Unit 29
- 1111 N 2000 W Unit 335
- 1111 N 2000 W Unit 288
- 1111 N 2000 W Unit 59
- 2594 W 1800 N
- 2983 W 1900 N
- 2801 W 1900 N
- 377 N 1900 St W
- 1663 N 3500 W
- 2268 W 1800 N
- 1410 N 1900 W
- 1917 W 250 N
- 1844 Heritage Ranch Dr
- 3122 W 1975 N