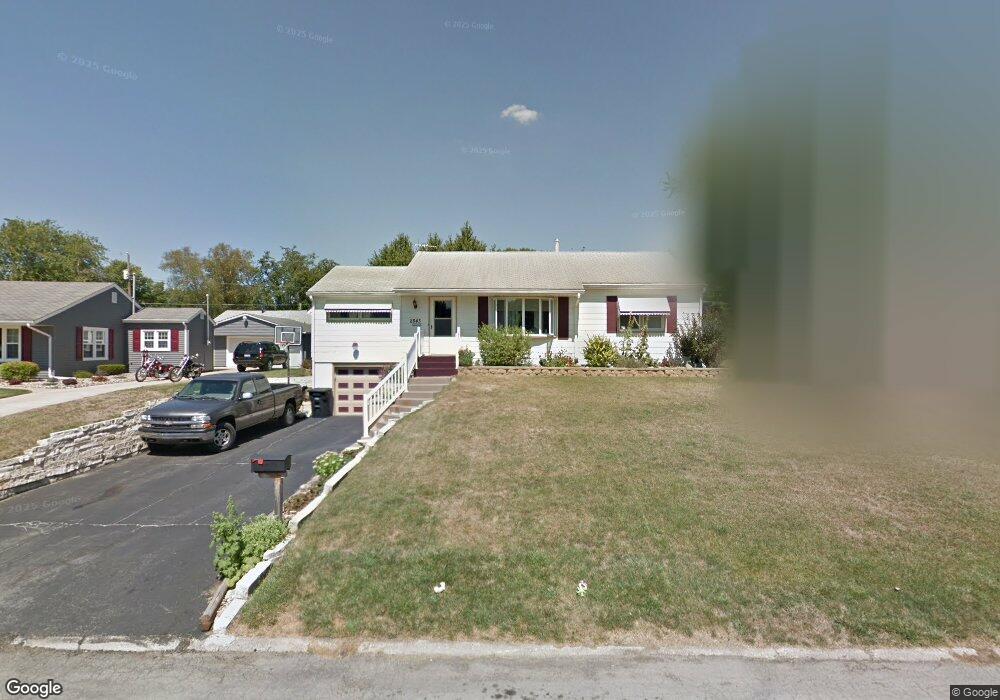
2843 39th Ave Rock Island, IA 61201
Blackhawk NeighborhoodEstimated Value: $170,670 - $184,000
2
Beds
2
Baths
1,200
Sq Ft
$147/Sq Ft
Est. Value
About This Home
This home is located at 2843 39th Ave, Rock Island, IA 61201 and is currently estimated at $176,918, approximately $147 per square foot. 2843 39th Ave is a home located in Rock Island County with nearby schools including Eugene Field Elementary School, Washington Junior High School, and Rock Island High School.
Ownership History
Date
Name
Owned For
Owner Type
Purchase Details
Closed on
Dec 4, 2024
Sold by
Davis Melbern
Bought by
Whitley Ravay
Current Estimated Value
Home Financials for this Owner
Home Financials are based on the most recent Mortgage that was taken out on this home.
Original Mortgage
$165,938
Outstanding Balance
$164,623
Interest Rate
6.75%
Mortgage Type
FHA
Estimated Equity
$12,295
Purchase Details
Closed on
Sep 1, 2008
Create a Home Valuation Report for This Property
The Home Valuation Report is an in-depth analysis detailing your home's value as well as a comparison with similar homes in the area
Home Values in the Area
Average Home Value in this Area
Purchase History
| Date | Buyer | Sale Price | Title Company |
|---|---|---|---|
| Whitley Ravay | $169,000 | Meridian Title | |
| -- | $107,000 | -- |
Source: Public Records
Mortgage History
| Date | Status | Borrower | Loan Amount |
|---|---|---|---|
| Open | Whitley Ravay | $165,938 |
Source: Public Records
Tax History Compared to Growth
Tax History
| Year | Tax Paid | Tax Assessment Tax Assessment Total Assessment is a certain percentage of the fair market value that is determined by local assessors to be the total taxable value of land and additions on the property. | Land | Improvement |
|---|---|---|---|---|
| 2024 | $4,750 | $53,198 | $12,010 | $41,188 |
| 2023 | $4,750 | $48,671 | $10,988 | $37,683 |
| 2022 | $3,751 | $42,671 | $9,634 | $33,037 |
| 2021 | $3,644 | $40,523 | $9,149 | $31,374 |
| 2020 | $3,551 | $39,419 | $8,900 | $30,519 |
| 2019 | $3,506 | $39,029 | $8,812 | $30,217 |
| 2018 | $3,331 | $38,003 | $8,580 | $29,423 |
| 2017 | $3,233 | $36,741 | $8,295 | $28,446 |
| 2016 | $3,128 | $36,741 | $8,295 | $28,446 |
| 2015 | $3,119 | $36,741 | $8,295 | $28,446 |
| 2014 | $778 | $37,019 | $8,358 | $28,661 |
| 2013 | $778 | $37,019 | $8,358 | $28,661 |
Source: Public Records
Map
Nearby Homes