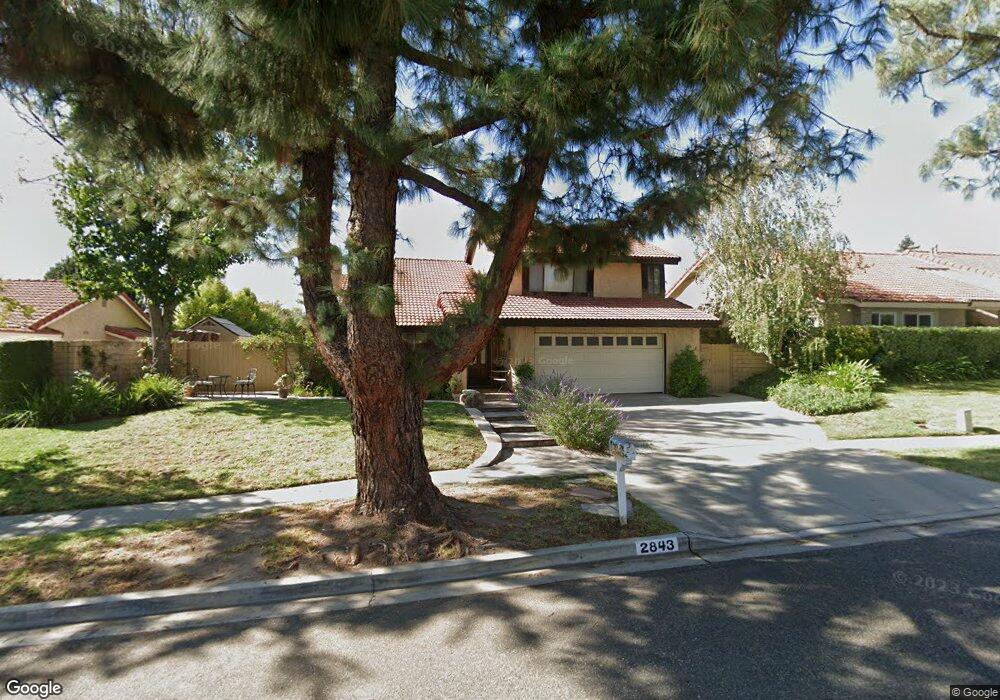
2843 Emily Ln Simi Valley, CA 93063
Central Simi Valley NeighborhoodEstimated Value: $885,834 - $947,000
4
Beds
3
Baths
1,983
Sq Ft
$466/Sq Ft
Est. Value
About This Home
This home is located at 2843 Emily Ln, Simi Valley, CA 93063 and is currently estimated at $924,459, approximately $466 per square foot. 2843 Emily Ln is a home located in Ventura County with nearby schools including Township Elementary School, Valley View Middle School, and Simi Valley High School.
Ownership History
Date
Name
Owned For
Owner Type
Purchase Details
Closed on
Jun 4, 2024
Sold by
Hoffman Michael Edward and Hoffman Joanna Miller
Bought by
Hoffman Family Trust and Hoffman
Current Estimated Value
Purchase Details
Closed on
Jan 12, 1996
Sold by
Prudential Home Mtg Company Inc
Bought by
Hoffman Michael Edward and Hoffman Joanna Miller
Home Financials for this Owner
Home Financials are based on the most recent Mortgage that was taken out on this home.
Original Mortgage
$194,750
Interest Rate
6.87%
Purchase Details
Closed on
Oct 24, 1995
Sold by
Gunn Thomas J and Gunn Joanna M
Bought by
The Prudential Home Mtg Company Inc
Purchase Details
Closed on
Oct 6, 1993
Sold by
Vale Gary M and Vale Denise L
Bought by
Gunn Thomas J and Gunn Joanna M
Home Financials for this Owner
Home Financials are based on the most recent Mortgage that was taken out on this home.
Original Mortgage
$220,500
Interest Rate
6.74%
Create a Home Valuation Report for This Property
The Home Valuation Report is an in-depth analysis detailing your home's value as well as a comparison with similar homes in the area
Home Values in the Area
Average Home Value in this Area
Purchase History
| Date | Buyer | Sale Price | Title Company |
|---|---|---|---|
| Hoffman Family Trust | -- | None Listed On Document | |
| Hoffman Michael Edward | $205,000 | Fidelity National Title | |
| The Prudential Home Mtg Company Inc | $225,000 | Continental Lawyers Title Co | |
| Gunn Thomas J | $245,000 | Chicago Title Insurance Co |
Source: Public Records
Mortgage History
| Date | Status | Borrower | Loan Amount |
|---|---|---|---|
| Previous Owner | Hoffman Michael Edward | $194,750 | |
| Previous Owner | Gunn Thomas J | $220,500 |
Source: Public Records
Tax History Compared to Growth
Tax History
| Year | Tax Paid | Tax Assessment Tax Assessment Total Assessment is a certain percentage of the fair market value that is determined by local assessors to be the total taxable value of land and additions on the property. | Land | Improvement |
|---|---|---|---|---|
| 2025 | $5,094 | $390,326 | $156,128 | $234,198 |
| 2024 | $5,094 | $382,673 | $153,067 | $229,606 |
| 2023 | $4,798 | $375,170 | $150,066 | $225,104 |
| 2022 | $4,769 | $367,814 | $147,123 | $220,691 |
| 2021 | $4,726 | $360,602 | $144,238 | $216,364 |
| 2020 | $4,625 | $356,907 | $142,760 | $214,147 |
| 2019 | $4,421 | $349,910 | $139,961 | $209,949 |
| 2018 | $4,378 | $343,050 | $137,217 | $205,833 |
| 2017 | $4,279 | $336,325 | $134,527 | $201,798 |
| 2016 | $4,093 | $329,732 | $131,890 | $197,842 |
| 2015 | $4,005 | $324,781 | $129,910 | $194,871 |
| 2014 | -- | $318,420 | $127,366 | $191,054 |
Source: Public Records
Map
Nearby Homes
- 2885 Circle View Dr
- 2842 Topaz Ave
- 3262 Avenida Simi
- 2848 Jadestone Ave
- 3160 Leslie Ct
- 3474 Highwood Ct Unit 80
- 3434 Highwood Ct Unit 183
- 2439 Lita Place
- 3060 Bianca Cir
- 2514 Glenhurst Ct
- 3445 Presidio Ct
- 3298 Wisdom Ct
- 3342 Darby St Unit 317
- 2753 Deerwood Ave
- 3306 Darby St Unit 402
- 3204 Darby St Unit 118
- 3192 Darby St Unit 114
- 2877 Avenida Simi
- 3049 Reservoir Dr
- 3265 Sheri Dr
- 2859 Emily Ln
- 2825 Emily Ln
- 2828 Tiffaney Ln
- 2840 Tiffaney Ln
- 2816 Tiffaney Ln
- 2875 Emily Ln
- 2809 Emily Ln
- 2860 Emily Ln
- 2844 Emily Ln
- 2852 Tiffaney Ln
- 2826 Emily Ln
- 2804 Tiffaney Ln
- 2891 Emily Ln
- 2812 Emily Ln
- 2876 Emily Ln
- 2864 Tiffaney Ln
- 2827 Tiffaney Ln
- 2825 Stacy Dr
- 2839 Tiffaney Ln
- 2840 Circle View Dr