Estimated Value: $557,705 - $602,000
4
Beds
3
Baths
1,976
Sq Ft
$292/Sq Ft
Est. Value
About This Home
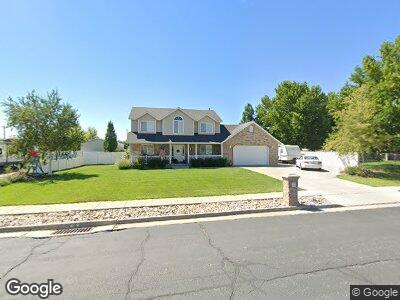
This home is located at 2843 N 4150 W, Ogden, UT 84404 and is currently estimated at $576,676, approximately $291 per square foot. 2843 N 4150 W is a home located in Weber County with nearby schools including Wahlquist Junior High School and Fremont High School.
Ownership History
Date
Name
Owned For
Owner Type
Purchase Details
Closed on
Dec 18, 2012
Sold by
Federal Home Loan Mortgage Corporation
Bought by
Matthews Thomas and Matthews Laura
Current Estimated Value
Home Financials for this Owner
Home Financials are based on the most recent Mortgage that was taken out on this home.
Original Mortgage
$191,565
Outstanding Balance
$134,802
Interest Rate
3.25%
Mortgage Type
FHA
Estimated Equity
$434,555
Purchase Details
Closed on
Oct 2, 2012
Sold by
Budge Ryan L and Budge Kimberly A
Bought by
Federal Home Loan Mortgage Corporation
Purchase Details
Closed on
Sep 8, 2006
Sold by
Verburg Michael J and Verburg Christine
Bought by
Budge Ryan L
Home Financials for this Owner
Home Financials are based on the most recent Mortgage that was taken out on this home.
Original Mortgage
$163,920
Interest Rate
7.37%
Mortgage Type
Purchase Money Mortgage
Create a Home Valuation Report for This Property
The Home Valuation Report is an in-depth analysis detailing your home's value as well as a comparison with similar homes in the area
Home Values in the Area
Average Home Value in this Area
Purchase History
| Date | Buyer | Sale Price | Title Company |
|---|---|---|---|
| Matthews Thomas | -- | First American Title Company | |
| Federal Home Loan Mortgage Corporation | -- | Lincoln Title Insurance Agen | |
| Budge Ryan L | -- | Security Title Of Davis Coun |
Source: Public Records
Mortgage History
| Date | Status | Borrower | Loan Amount |
|---|---|---|---|
| Open | Matthews Thomas | $191,565 | |
| Previous Owner | Budge Ryan L | $20,000 | |
| Previous Owner | Budge Ryan L | $211,850 | |
| Previous Owner | Budge Ryan L | $163,920 |
Source: Public Records
Tax History Compared to Growth
Tax History
| Year | Tax Paid | Tax Assessment Tax Assessment Total Assessment is a certain percentage of the fair market value that is determined by local assessors to be the total taxable value of land and additions on the property. | Land | Improvement |
|---|---|---|---|---|
| 2024 | $2,706 | $273,899 | $102,284 | $171,615 |
| 2023 | $2,625 | $265,650 | $96,925 | $168,725 |
| 2022 | $2,885 | $303,600 | $92,015 | $211,585 |
| 2021 | $2,232 | $386,000 | $97,925 | $288,075 |
| 2020 | $2,132 | $339,000 | $73,429 | $265,571 |
| 2019 | $2,041 | $305,000 | $63,448 | $241,552 |
| 2018 | $1,991 | $284,000 | $63,448 | $220,552 |
| 2017 | $1,826 | $245,000 | $57,656 | $187,344 |
| 2016 | $1,741 | $127,356 | $30,198 | $97,158 |
| 2015 | $1,770 | $127,356 | $30,198 | $97,158 |
| 2014 | $1,608 | $111,959 | $27,474 | $84,485 |
Source: Public Records
Map
Nearby Homes
- 4024 W 2875 N
- 3932 W 2875 N
- 4075 W 2600 N
- 2528 N 4350 W
- 3855 W 2600 N
- 2649 N 3975 W
- 4422 W 2425 N
- 4302 W 2350 N
- 2924 N 3550 W
- 3966 W 2200 N
- 2881 N 3475 W Unit 17
- 2833 N 3475 W
- 3632 W 2200 St N Unit 24
- 3622 W 2200 St N Unit 23
- 2450 N 3825 W
- 3415 W North Plain City Rd
- 2233 N 3600 St W Unit 22
- 2255 N 3600 St W Unit 21
- 3117 N 3450 W
- 3199 N 3500 W Unit 379