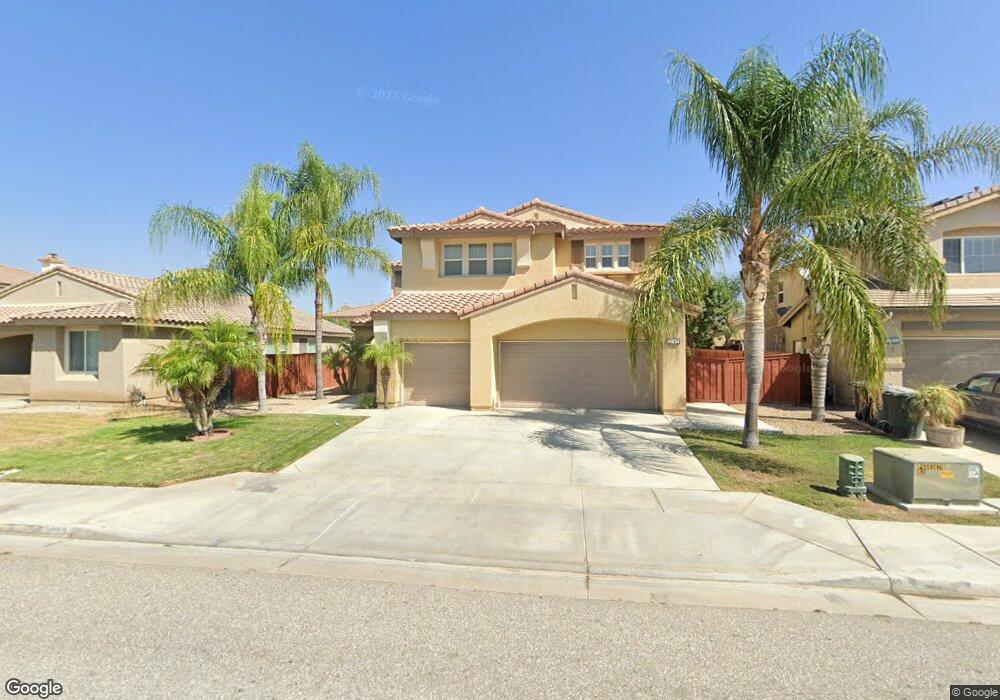
2843 Pansy Way San Jacinto, CA 92582
Estimated Value: $537,049 - $553,000
4
Beds
3
Baths
3,042
Sq Ft
$179/Sq Ft
Est. Value
About This Home
This home is located at 2843 Pansy Way, San Jacinto, CA 92582 and is currently estimated at $544,262, approximately $178 per square foot. 2843 Pansy Way is a home located in Riverside County with nearby schools including Megan Cope Elementary School, Monte Vista Middle School, and San Jacinto High School.
Ownership History
Date
Name
Owned For
Owner Type
Purchase Details
Closed on
Jun 24, 2019
Sold by
Cheung Andy U
Bought by
Cheung Andy U and Teang Seakchou
Current Estimated Value
Home Financials for this Owner
Home Financials are based on the most recent Mortgage that was taken out on this home.
Original Mortgage
$247,500
Outstanding Balance
$217,172
Interest Rate
4%
Mortgage Type
New Conventional
Estimated Equity
$327,090
Purchase Details
Closed on
Aug 3, 2009
Sold by
Fdic
Bought by
Cheung Andy
Purchase Details
Closed on
Apr 23, 2009
Sold by
Elan Willan A and Elan Lydia Dela Cruz
Bought by
Indymac Federal Bank Fsb
Purchase Details
Closed on
Jun 16, 2005
Sold by
Continental Residential Inc
Bought by
Elan William A and Elan Lydia Dela Cruz
Home Financials for this Owner
Home Financials are based on the most recent Mortgage that was taken out on this home.
Original Mortgage
$316,304
Interest Rate
5.62%
Mortgage Type
Fannie Mae Freddie Mac
Create a Home Valuation Report for This Property
The Home Valuation Report is an in-depth analysis detailing your home's value as well as a comparison with similar homes in the area
Home Values in the Area
Average Home Value in this Area
Purchase History
| Date | Buyer | Sale Price | Title Company |
|---|---|---|---|
| Cheung Andy U | -- | First American Title Co | |
| Cheung Andy | $143,500 | Chicago Title Company | |
| Indymac Federal Bank Fsb | $170,318 | None Available | |
| Elan William A | $395,500 | Chicago Title Company |
Source: Public Records
Mortgage History
| Date | Status | Borrower | Loan Amount |
|---|---|---|---|
| Open | Cheung Andy U | $247,500 | |
| Previous Owner | Elan William A | $316,304 |
Source: Public Records
Tax History Compared to Growth
Tax History
| Year | Tax Paid | Tax Assessment Tax Assessment Total Assessment is a certain percentage of the fair market value that is determined by local assessors to be the total taxable value of land and additions on the property. | Land | Improvement |
|---|---|---|---|---|
| 2025 | $5,593 | $185,215 | $64,529 | $120,686 |
| 2023 | $5,593 | $178,024 | $62,024 | $116,000 |
| 2022 | $5,446 | $174,534 | $60,808 | $113,726 |
| 2021 | $5,317 | $171,113 | $59,616 | $111,497 |
| 2020 | $5,195 | $169,359 | $59,005 | $110,354 |
| 2019 | $5,040 | $166,040 | $57,850 | $108,190 |
| 2018 | $5,046 | $162,785 | $56,716 | $106,069 |
| 2017 | $4,890 | $159,594 | $55,604 | $103,990 |
| 2016 | $4,598 | $156,465 | $54,514 | $101,951 |
| 2015 | $4,836 | $154,117 | $53,697 | $100,420 |
| 2014 | $4,769 | $151,100 | $52,647 | $98,453 |
Source: Public Records
Map
Nearby Homes
- 594 Hyacinth Rd
- 630 Drake Dr
- 557 Peregrine Ln
- 537 Peregrine Ln
- 2819 Eureka Rd
- 477 Overleaf Way
- 3095 Desiree Dr
- 3065 Desiree Dr
- 3025 Desiree Dr
- 3075 Desiree Dr
- 2961 Desiree Dr
- 629 Peregrine Ln
- 761 Longhorn Dr
- 748 Longhorn Dr
- 735 Belmont Ln
- 722 Belmont Ln
- 749 Belmont Ln
- 278 Overleaf Way
- 723 Highlands Dr
- 750 Belmont Ln
- 2833 Pansy Way
- 2842 Hartley Pkwy
- 2832 Hartley Pkwy
- 2852 Hartley Pkwy
- 2823 Pansy Way
- 2863 Pansy Way
- 2822 Hartley Pkwy
- 2862 Hartley Pkwy
- 2844 Pansy Way
- 2854 Pansy Way
- 2834 Pansy Way
- 2813 Pansy Way
- 2873 Pansy Way
- 2864 Pansy Way
- 2824 Pansy Way
- 2872 Hartley Pkwy
- 2874 Pansy Way
- 2773 Pansy Way
- 2883 Pansy Way
- 2814 Pansy Way