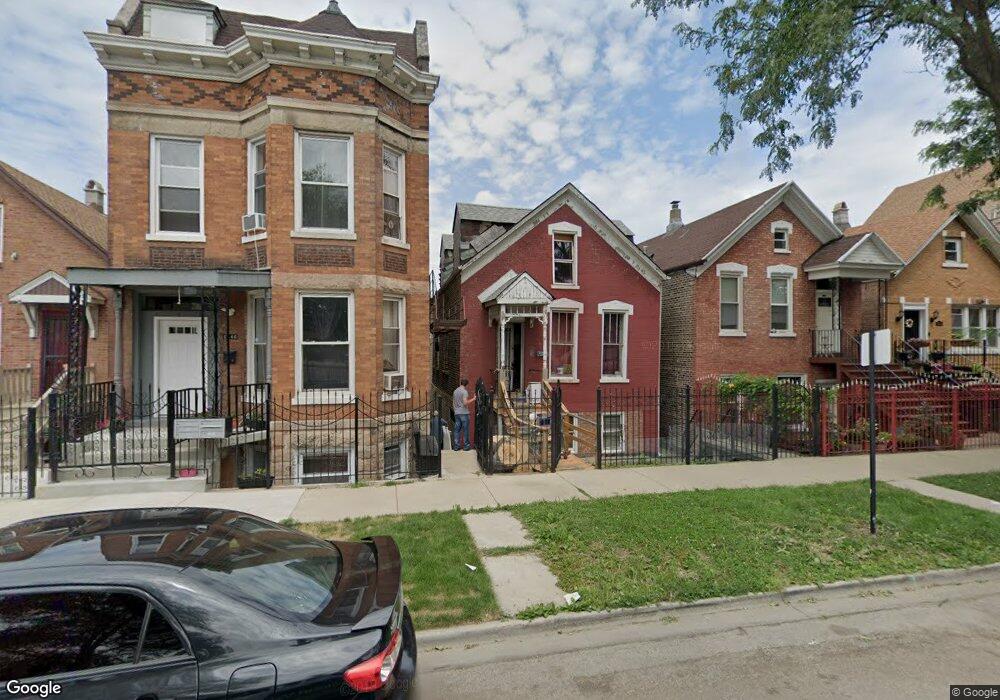
2844 W 21st Place Chicago, IL 60623
Little Village NeighborhoodEstimated Value: $270,000 - $360,000
1
Bed
2
Baths
1,285
Sq Ft
$240/Sq Ft
Est. Value
About This Home
This home is located at 2844 W 21st Place, Chicago, IL 60623 and is currently estimated at $308,019, approximately $239 per square foot. 2844 W 21st Place is a home located in Cook County with nearby schools including Hammond Elementary School, Acero - Octavio Paz Elementary School, and Latino Youth High School.
Ownership History
Date
Name
Owned For
Owner Type
Purchase Details
Closed on
May 29, 2011
Sold by
Fannie Mae
Bought by
Castaneda Abdias R
Current Estimated Value
Purchase Details
Closed on
Mar 16, 2011
Sold by
Schlie Kyle J
Bought by
Federal National Mortgage Association
Purchase Details
Closed on
Jul 21, 2006
Sold by
Reyes Wilson and Reyes Josifina
Bought by
Schlie Kyle
Home Financials for this Owner
Home Financials are based on the most recent Mortgage that was taken out on this home.
Original Mortgage
$198,000
Interest Rate
6.73%
Mortgage Type
Unknown
Purchase Details
Closed on
Aug 31, 2000
Sold by
Moreno Genevieve
Bought by
Wilson Reyes Josefina and Wilson Reyes
Home Financials for this Owner
Home Financials are based on the most recent Mortgage that was taken out on this home.
Original Mortgage
$84,850
Interest Rate
7.96%
Create a Home Valuation Report for This Property
The Home Valuation Report is an in-depth analysis detailing your home's value as well as a comparison with similar homes in the area
Home Values in the Area
Average Home Value in this Area
Purchase History
| Date | Buyer | Sale Price | Title Company |
|---|---|---|---|
| Castaneda Abdias R | $19,000 | First American Title | |
| Federal National Mortgage Association | -- | None Available | |
| Schlie Kyle | $220,000 | Heritage Title Company | |
| Wilson Reyes Josefina | -- | Professional National Title |
Source: Public Records
Mortgage History
| Date | Status | Borrower | Loan Amount |
|---|---|---|---|
| Previous Owner | Schlie Kyle | $198,000 | |
| Previous Owner | Wilson Reyes Josefina | $84,850 |
Source: Public Records
Tax History Compared to Growth
Tax History
| Year | Tax Paid | Tax Assessment Tax Assessment Total Assessment is a certain percentage of the fair market value that is determined by local assessors to be the total taxable value of land and additions on the property. | Land | Improvement |
|---|---|---|---|---|
| 2024 | $4,009 | $25,001 | $4,713 | $20,288 |
| 2023 | $3,908 | $19,000 | $3,819 | $15,181 |
| 2022 | $3,908 | $19,000 | $3,819 | $15,181 |
| 2021 | $3,821 | $18,999 | $3,818 | $15,181 |
| 2020 | $3,483 | $15,633 | $3,818 | $11,815 |
| 2019 | $3,569 | $17,765 | $3,818 | $13,947 |
| 2018 | $3,509 | $17,765 | $3,818 | $13,947 |
| 2017 | $3,210 | $14,910 | $3,412 | $11,498 |
| 2016 | $2,986 | $14,910 | $3,412 | $11,498 |
| 2015 | $2,732 | $14,910 | $3,412 | $11,498 |
| 2014 | $2,489 | $13,413 | $3,250 | $10,163 |
| 2013 | $776 | $4,266 | $3,250 | $1,016 |
Source: Public Records
Map
Nearby Homes
- 2835 W Cullerton St
- 2824 W Cermak Rd
- 2653 W 21st St
- 2249 S Marshall Blvd
- 2649 W 21st Place
- 2613 W 21st St
- 2732 W 23rd Place
- 2306 S Sacramento Ave
- 2326 S Sacramento Ave
- 2340 S Sacramento Ave
- 2702 W 24th St
- 2633 W 23rd Place
- 2251 S Troy St
- 2604 W 23rd Place
- 2236 W 23rd Place
- 2658 W 24th Place
- 2848 W 25th St
- 2655 W 24th Place
- 2713 W 24th Place
- 2701 W 24th Place
- 2842 W 21st Place
- 2846 W 21st Place
- 2846 W 21st Place Unit 2F
- 2840 W 21st Place
- 2840 W 21st Place Unit 1
- 2855 W 21st Place
- 2850 W 21st Place
- 2836 W 21st Place
- 2836 W 21st Place
- 2852 W 21st Place
- 2834 W 21st Place
- 2854 W 21st Place
- 2843 W 21st St
- 2843 W 21st St
- 2847 W 21st St Unit 4
- 2847 W 21st St
- 2832 W 21st Place
- 2856 W 21st Place
- 2858 W 21st Place
- 2858 W 21st Place