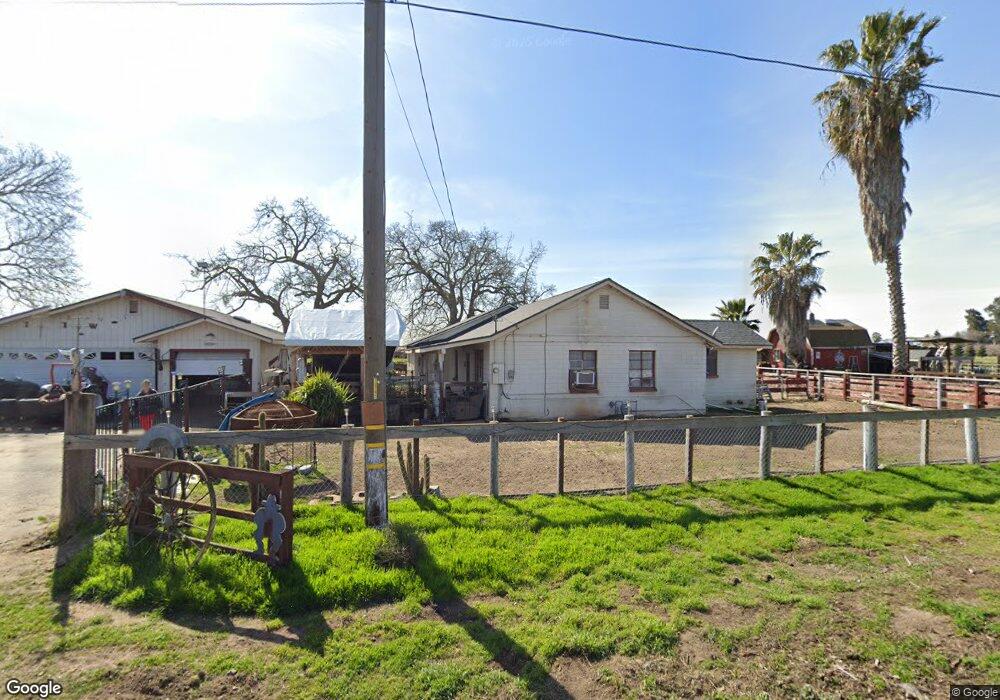
28449 Two Rivers Rd Manteca, CA 95337
Estimated Value: $594,349 - $1,039,000
4
Beds
1
Bath
1,732
Sq Ft
$455/Sq Ft
Est. Value
About This Home
This home is located at 28449 Two Rivers Rd, Manteca, CA 95337 and is currently estimated at $787,587, approximately $454 per square foot. 28449 Two Rivers Rd is a home located in San Joaquin County with nearby schools including Nile Garden Elementary School and Sierra High School.
Ownership History
Date
Name
Owned For
Owner Type
Purchase Details
Closed on
Oct 11, 2021
Sold by
Cidelia Barela Sanchez Living Trust and Sanchez Cidelia B
Bought by
Sanchez Cidelia B and Barnes Novella Ann
Current Estimated Value
Home Financials for this Owner
Home Financials are based on the most recent Mortgage that was taken out on this home.
Original Mortgage
$500,000
Outstanding Balance
$455,953
Interest Rate
2.8%
Mortgage Type
New Conventional
Estimated Equity
$331,634
Purchase Details
Closed on
May 19, 2006
Sold by
Sanchez Cidelia B
Bought by
Sanchez Cidelia B
Purchase Details
Closed on
Feb 3, 1994
Sold by
Sanchez Cidelia B
Bought by
Sanchez Cidelia B
Home Financials for this Owner
Home Financials are based on the most recent Mortgage that was taken out on this home.
Original Mortgage
$30,000
Interest Rate
6.98%
Create a Home Valuation Report for This Property
The Home Valuation Report is an in-depth analysis detailing your home's value as well as a comparison with similar homes in the area
Purchase History
| Date | Buyer | Sale Price | Title Company |
|---|---|---|---|
| Sanchez Cidelia B | -- | Placer Title | |
| Sanchez Cidelia B | -- | None Available | |
| Sanchez Cidelia B | -- | North American Title |
Source: Public Records
Mortgage History
| Date | Status | Borrower | Loan Amount |
|---|---|---|---|
| Open | Sanchez Cidelia B | $500,000 | |
| Previous Owner | Sanchez Cidelia B | $30,000 |
Source: Public Records
Tax History
| Year | Tax Paid | Tax Assessment Tax Assessment Total Assessment is a certain percentage of the fair market value that is determined by local assessors to be the total taxable value of land and additions on the property. | Land | Improvement |
|---|---|---|---|---|
| 2025 | $5,995 | $249,451 | $114,683 | $134,768 |
| 2024 | $5,846 | $244,561 | $112,435 | $132,126 |
| 2023 | $3,267 | $239,767 | $110,231 | $129,536 |
| 2022 | $3,228 | $235,067 | $108,070 | $126,997 |
| 2021 | $3,199 | $230,458 | $105,951 | $124,507 |
| 2020 | $3,094 | $228,096 | $104,865 | $123,231 |
| 2019 | $3,061 | $223,624 | $102,809 | $120,815 |
| 2018 | $2,973 | $219,241 | $100,794 | $118,447 |
| 2017 | $2,893 | $214,943 | $98,818 | $116,125 |
| 2016 | $2,835 | $210,730 | $96,881 | $113,849 |
| 2014 | $2,797 | $203,500 | $93,558 | $109,942 |
Source: Public Records
Map
Nearby Homes
- 30000 Kasson Rd 1b26 S Redwood Dr
- 30000 Kasson Rd 2k4 Sunset Dr
- 30000 Kasson Rd 1b1 Evergreen
- 30000 S Kasson Rd
- 278 Victorious St
- 2038 Wawona St
- 2182 Silk Ave
- 2847 Sunbeam Ln
- 22082 Oleander Ave
- 2830 Sunbeam Ln
- 25687 Kasson Rd
- 2814 Sunbeam Ln
- 2806 Sunbeam Ln
- 332 Solis Ct
- 2710 Sunbeam Ln
- 2720 Blairsville Ln
- 2716 Blairsville Ln
- 2724 Blairsville Ln
- 2633 Coolidge Place
- 1187 S Mohler Rd
- 6266 Avenue D
- 6371 Avenue D
- 28533 Two Rivers Rd
- 28251 Two Rivers Rd
- 6250 Avenue D
- 28013 2 Rivers Rd
- 28013 Two Rivers Rd
- 6225 Avenue D
- 28141 Two Rivers Rd
- 6710 Avenue D
- 28001 Two Rivers Rd
- 6890 Avenue D
- 5880 Avenue D
- 28128 Two Rivers Rd
- 7001 Avenue D
- 7000 Avenue D
- 27798 Two Rivers Rd
- 27415 Two Rivers Rd
- 27626 S Union Rd
- 28522 S Airport Way
Your Personal Tour Guide
Ask me questions while you tour the home.