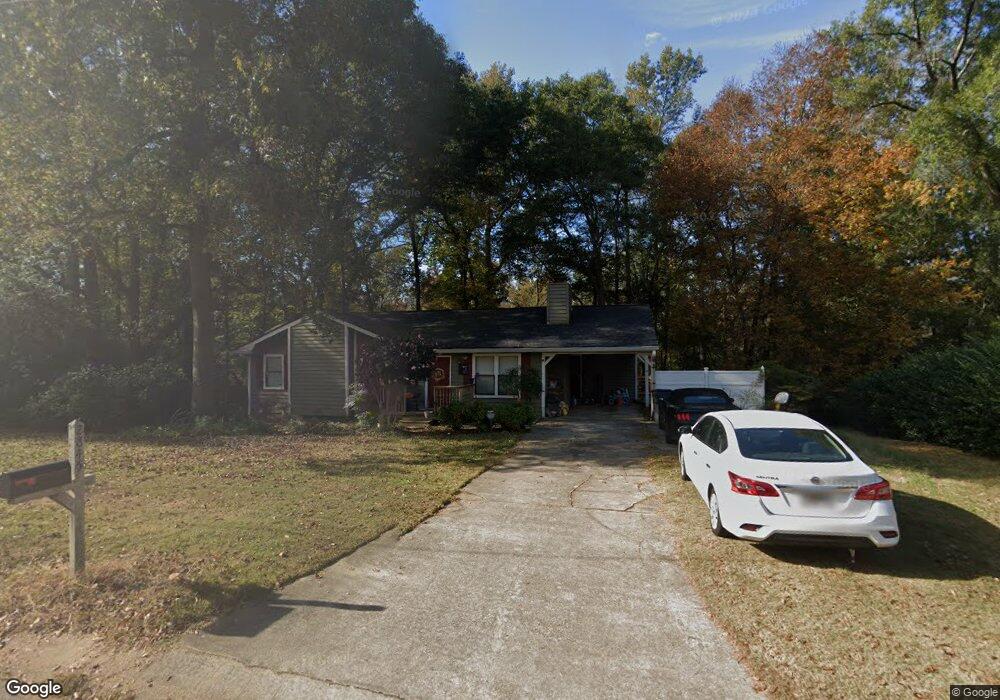
2845 Cinnamon Ct SE Conyers, GA 30094
Estimated Value: $229,000 - $250,666
3
Beds
2
Baths
2,328
Sq Ft
$103/Sq Ft
Est. Value
About This Home
This home is located at 2845 Cinnamon Ct SE, Conyers, GA 30094 and is currently estimated at $238,917, approximately $102 per square foot. 2845 Cinnamon Ct SE is a home located in Rockdale County with nearby schools including Honey Creek Elementary School, Edwards Middle School, and Salem High School.
Ownership History
Date
Name
Owned For
Owner Type
Purchase Details
Closed on
Aug 28, 2017
Sold by
Bayless Norman G
Bought by
Sengmany Jessica and Sengmany Phonepanom
Current Estimated Value
Home Financials for this Owner
Home Financials are based on the most recent Mortgage that was taken out on this home.
Original Mortgage
$112,917
Outstanding Balance
$95,167
Interest Rate
4.25%
Mortgage Type
FHA
Estimated Equity
$143,750
Purchase Details
Closed on
Feb 11, 2009
Sold by
Bayless Norm
Bought by
Bayless Norman G
Home Financials for this Owner
Home Financials are based on the most recent Mortgage that was taken out on this home.
Original Mortgage
$104,449
Interest Rate
5.03%
Mortgage Type
FHA
Purchase Details
Closed on
Feb 4, 2003
Sold by
Watkins Carlton L
Bought by
Bayless Norm
Home Financials for this Owner
Home Financials are based on the most recent Mortgage that was taken out on this home.
Original Mortgage
$106,331
Interest Rate
5.95%
Mortgage Type
FHA
Create a Home Valuation Report for This Property
The Home Valuation Report is an in-depth analysis detailing your home's value as well as a comparison with similar homes in the area
Home Values in the Area
Average Home Value in this Area
Purchase History
| Date | Buyer | Sale Price | Title Company |
|---|---|---|---|
| Sengmany Jessica | $115,000 | -- | |
| Bayless Norman G | -- | -- | |
| Bayless Norm | $54,000 | -- | |
| Bayless Norm | $54,000 | -- |
Source: Public Records
Mortgage History
| Date | Status | Borrower | Loan Amount |
|---|---|---|---|
| Open | Sengmany Jessica | $112,917 | |
| Previous Owner | Bayless Norman G | $104,449 | |
| Previous Owner | Bayless Norm | $106,331 |
Source: Public Records
Tax History Compared to Growth
Tax History
| Year | Tax Paid | Tax Assessment Tax Assessment Total Assessment is a certain percentage of the fair market value that is determined by local assessors to be the total taxable value of land and additions on the property. | Land | Improvement |
|---|---|---|---|---|
| 2024 | $1,836 | $79,800 | $15,200 | $64,600 |
| 2023 | $1,831 | $81,880 | $18,000 | $63,880 |
| 2022 | $1,282 | $60,480 | $13,080 | $47,400 |
| 2021 | $802 | $40,240 | $7,000 | $33,240 |
| 2020 | $757 | $40,240 | $7,000 | $33,240 |
| 2019 | $776 | $40,240 | $7,000 | $33,240 |
| 2018 | $1,528 | $33,880 | $6,000 | $27,880 |
| 2017 | $254 | $23,080 | $4,400 | $18,680 |
| 2016 | $234 | $23,080 | $4,400 | $18,680 |
| 2015 | $227 | $22,800 | $4,400 | $18,400 |
| 2014 | $181 | $21,800 | $3,400 | $18,400 |
| 2013 | -- | $30,760 | $7,600 | $23,160 |
Source: Public Records
Map
Nearby Homes
- 1813 Holmsey Cir
- 917 Curry Cir SE
- 2924 Raintree Dr SE
- 2923 Raintree Dr SE
- 820 Bridgewater Way SE
- 812 Raintree Way SE
- 1920 Logan Ln
- 693 Deering Rd SE
- 726 Shoreline Trail SE
- 665 Huron Ct SE
- 3014 Lakeridge Dr SE
- 3021 Lakeridge Dr SE
- 3027 Lakeridge Dr SE
- 2987 Landmark Dr SE
- 2754 Harvest Dr SE
- 1115 Fountain Crest Dr
- 574 Almand Branch Rd SE Unit 1
- 2717 Stanton Woods Dr SE
- 2684 Harvest Dr SE
- 549 Greenview Ave SE
- 2847 Cinnamon Ct SE
- 2843 Cinnamon Ct SE Unit 1
- 2851 Cinnamon Ct SE
- 2844 Cinnamon Ct SE
- 2848 Cinnamon Ct SE
- 2841 Cinnamon Ct SE
- 2853 Cinnamon Ct SE
- 2852 Cinnamon Ct SE
- 911 Curry Cir SE
- 2857 Cinnamon Ct SE
- 2926 Raintree Dr SE
- 2928 Raintree Dr SE
- 915 Curry Cir SE
- 2856 Cinnamon Ct SE
- 2924 Raintree Dr SE Unit 179
- 2930 Raintree Dr SE
- 2859 Cinnamon Ct SE
- 2859 Cinnamon Ct SE Unit 1
- 2860 Cinnamon Ct SE
- 910 Curry Cir SE