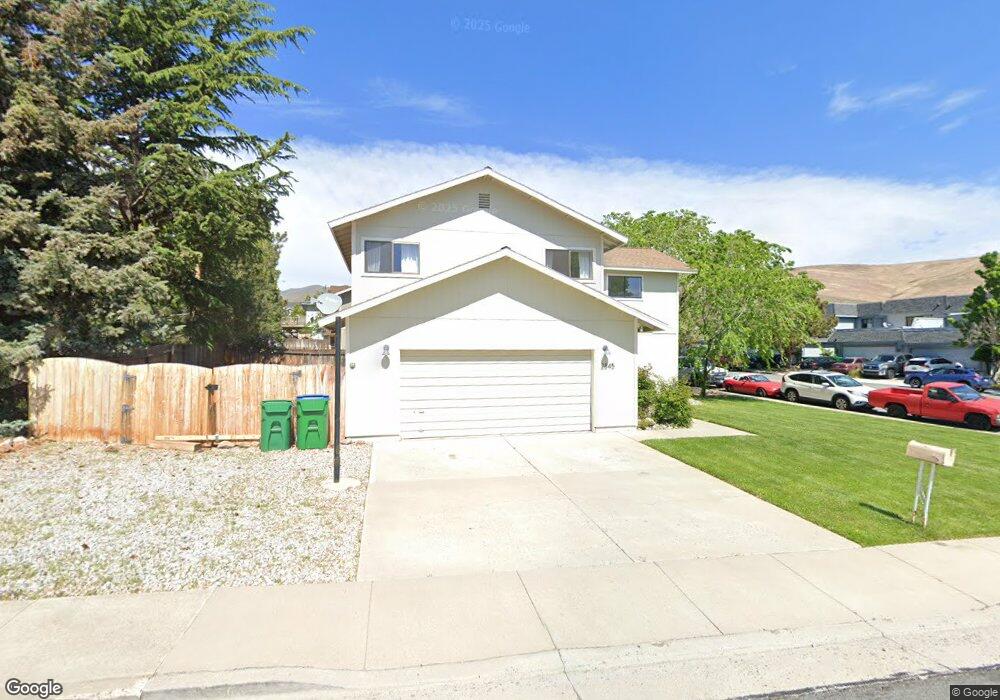
2845 Columbus Way Reno, NV 89503
Kings Row NeighborhoodEstimated Value: $538,000 - $579,000
3
Beds
3
Baths
1,556
Sq Ft
$356/Sq Ft
Est. Value
About This Home
This home is located at 2845 Columbus Way, Reno, NV 89503 and is currently estimated at $554,261, approximately $356 per square foot. 2845 Columbus Way is a home located in Washoe County with nearby schools including Mamie Towles Elementary School, Archie Clayton Pre-AP Academy, and Robert McQueen High School.
Ownership History
Date
Name
Owned For
Owner Type
Purchase Details
Closed on
Sep 12, 2015
Sold by
Myrah Ynonne M
Bought by
Myrah Donadl V
Current Estimated Value
Purchase Details
Closed on
Dec 28, 2004
Sold by
Myrah Donald V and Myrah Geralynn V
Bought by
Myrah Donald V and Myrah Yvonne M
Home Financials for this Owner
Home Financials are based on the most recent Mortgage that was taken out on this home.
Original Mortgage
$200,000
Outstanding Balance
$100,910
Interest Rate
5.74%
Mortgage Type
Seller Take Back
Estimated Equity
$453,351
Purchase Details
Closed on
Jan 14, 2003
Sold by
Holling Susan Ann
Bought by
Myrah Donald V and Myrah Geralynn V
Purchase Details
Closed on
Mar 19, 1997
Sold by
Pepe John C
Bought by
Holling Susan Ann
Home Financials for this Owner
Home Financials are based on the most recent Mortgage that was taken out on this home.
Original Mortgage
$98,000
Interest Rate
8.75%
Create a Home Valuation Report for This Property
The Home Valuation Report is an in-depth analysis detailing your home's value as well as a comparison with similar homes in the area
Home Values in the Area
Average Home Value in this Area
Purchase History
| Date | Buyer | Sale Price | Title Company |
|---|---|---|---|
| Myrah Donadl V | -- | None Available | |
| Myrah Donald V | $285,000 | Founders Title Company Of Nv | |
| Myrah Donald V | $191,500 | Stewart Title Of Northern Nv | |
| Holling Susan Ann | $1,500 | First American Title Co |
Source: Public Records
Mortgage History
| Date | Status | Borrower | Loan Amount |
|---|---|---|---|
| Open | Myrah Donald V | $200,000 | |
| Previous Owner | Holling Susan Ann | $98,000 | |
| Closed | Myrah Donald V | $85,000 |
Source: Public Records
Tax History Compared to Growth
Tax History
| Year | Tax Paid | Tax Assessment Tax Assessment Total Assessment is a certain percentage of the fair market value that is determined by local assessors to be the total taxable value of land and additions on the property. | Land | Improvement |
|---|---|---|---|---|
| 2025 | $2,266 | $73,804 | $38,570 | $35,235 |
| 2024 | $2,095 | $71,060 | $34,965 | $36,096 |
| 2023 | $1,449 | $71,845 | $37,170 | $34,675 |
| 2022 | $1,941 | $59,015 | $29,785 | $29,230 |
| 2021 | $1,797 | $50,815 | $21,350 | $29,465 |
| 2020 | $1,690 | $53,622 | $23,730 | $29,892 |
| 2019 | $1,610 | $52,879 | $23,625 | $29,254 |
| 2018 | $1,535 | $44,135 | $15,155 | $28,980 |
| 2017 | $1,472 | $42,413 | $13,090 | $29,323 |
| 2016 | $2,328 | $43,530 | $13,370 | $30,160 |
| 2015 | $2,272 | $41,846 | $11,375 | $30,471 |
| 2014 | $1,974 | $41,116 | $11,655 | $29,461 |
| 2013 | -- | $36,689 | $7,385 | $29,304 |
Source: Public Records
Map
Nearby Homes
- 3967 Kings Row
- 3981 Regal Dr
- 3996 Buckingham Square
- 2967 Aspendale Dr
- 4059 Kings Row
- 3520 Balboa Dr
- 3181 Sky Country Dr
- 3435 Balboa Dr
- 3160 Sky Country Dr
- 3235 Bryan St
- 3201 Green River Dr
- 2645 Emily St
- 1350 Marne Dr
- 2195 Santona Cir
- 2210 Altamira Dr
- 1200 Wild Oak Ct
- 1265 Searchlite Ct
- 3887 Allen Glen Dr
- 1270 Searchlite Ct
- 5715 W Brookdale Dr
- 3980 Kings Row
- 2835 Columbus Way
- 2850 Columbus Way Unit ID1250758P
- 2850 Columbus Way
- 3990 Kings Row
- 3959 Kings Row Unit 1
- 3963 Kings Row Unit 1
- 3965 Kings Row Unit 1
- 3955 Kings Row
- 3953 Kings Row Unit 1
- 3949 Kings Row
- 3951 Kings Row
- 3969 Kings Row
- 2840 Columbus Way
- 3950 Kings Row
- 3971 Kings Row
- 3994 Kings Row
- 2815 Columbus Way
- 2830 Columbus Way
- 3947 Kings Row