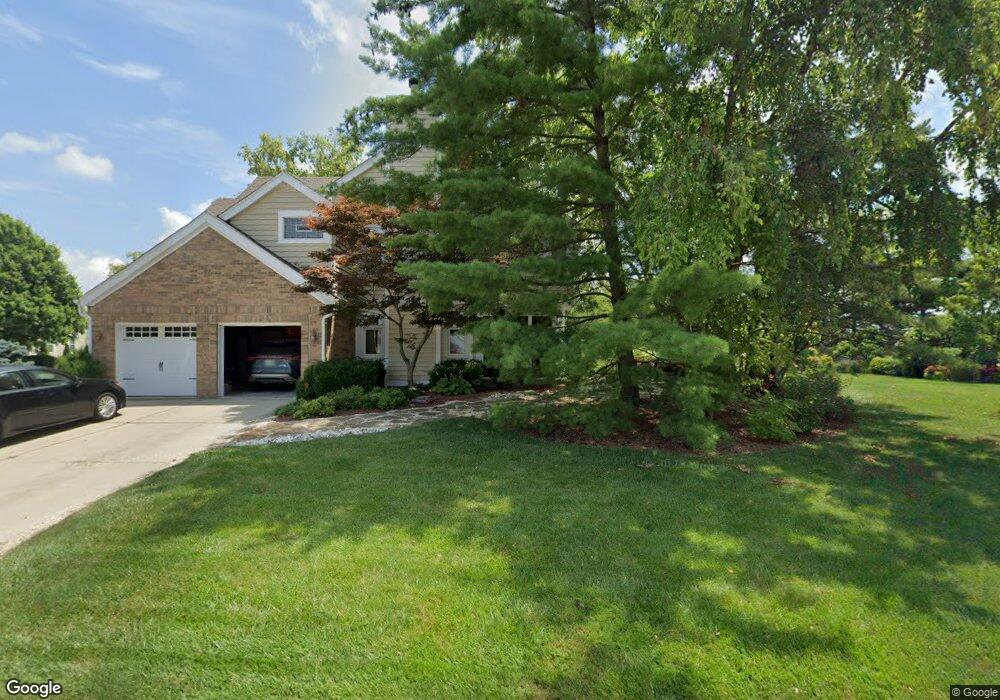
2845 E Cove Ln Maineville, OH 45039
Landen NeighborhoodEstimated Value: $546,000 - $616,000
4
Beds
4
Baths
2,478
Sq Ft
$235/Sq Ft
Est. Value
About This Home
This home is located at 2845 E Cove Ln, Maineville, OH 45039 and is currently estimated at $581,684, approximately $234 per square foot. 2845 E Cove Ln is a home located in Warren County with nearby schools including Kings Junior High School, Kings High School, and King Of Kings Lutheran Early Childhood Education.
Ownership History
Date
Name
Owned For
Owner Type
Purchase Details
Closed on
Nov 30, 2004
Sold by
Owens John S and Owens Nancy L
Bought by
Stone Mark R and Stone Kim H
Current Estimated Value
Home Financials for this Owner
Home Financials are based on the most recent Mortgage that was taken out on this home.
Original Mortgage
$247,200
Outstanding Balance
$119,352
Interest Rate
5.71%
Mortgage Type
Purchase Money Mortgage
Estimated Equity
$462,332
Purchase Details
Closed on
Dec 20, 1994
Sold by
Krejmas Al P
Bought by
Owens John S and Owens Nancy L
Home Financials for this Owner
Home Financials are based on the most recent Mortgage that was taken out on this home.
Original Mortgage
$149,600
Interest Rate
7.25%
Mortgage Type
New Conventional
Purchase Details
Closed on
Mar 2, 1990
Sold by
Robert Lucke Homes & Inc
Bought by
Krejmas and Krejmas Al P
Purchase Details
Closed on
Aug 2, 1989
Sold by
Landen Farm Company
Bought by
Robert Lucke Homes & Inc
Purchase Details
Closed on
Oct 16, 1987
Sold by
Landen Farm Company
Bought by
Landen Farm Company
Create a Home Valuation Report for This Property
The Home Valuation Report is an in-depth analysis detailing your home's value as well as a comparison with similar homes in the area
Home Values in the Area
Average Home Value in this Area
Purchase History
| Date | Buyer | Sale Price | Title Company |
|---|---|---|---|
| Stone Mark R | $309,000 | Prodigy Title | |
| Owens John S | $190,000 | -- | |
| Krejmas | $190,300 | -- | |
| Robert Lucke Homes & Inc | $25,700 | -- | |
| Landen Farm Company | -- | -- |
Source: Public Records
Mortgage History
| Date | Status | Borrower | Loan Amount |
|---|---|---|---|
| Open | Stone Mark R | $247,200 | |
| Previous Owner | Owens John S | $149,600 | |
| Closed | Stone Mark R | $61,800 |
Source: Public Records
Tax History
| Year | Tax Paid | Tax Assessment Tax Assessment Total Assessment is a certain percentage of the fair market value that is determined by local assessors to be the total taxable value of land and additions on the property. | Land | Improvement |
|---|---|---|---|---|
| 2025 | $8,382 | $161,320 | $38,500 | $122,820 |
| 2024 | $8,382 | $161,320 | $38,500 | $122,820 |
| 2023 | $7,032 | $121,537 | $21,752 | $99,785 |
| 2022 | $6,910 | $121,538 | $21,753 | $99,785 |
| 2021 | $5,786 | $121,538 | $21,753 | $99,785 |
| 2020 | $6,084 | $107,555 | $19,250 | $88,305 |
| 2019 | $6,160 | $107,555 | $19,250 | $88,305 |
| 2018 | $6,147 | $107,555 | $19,250 | $88,305 |
| 2017 | $6,068 | $94,269 | $18,085 | $76,185 |
| 2016 | $6,223 | $94,269 | $18,085 | $76,185 |
| 2015 | $5,213 | $94,269 | $18,085 | $76,185 |
| 2014 | $5,213 | $81,970 | $15,730 | $66,250 |
| 2013 | $5,221 | $100,340 | $19,250 | $81,090 |
Source: Public Records
Map
Nearby Homes
- 8050 Halyard Ct
- 2675 Carriagegate Ln
- 7740 Hackney Cir
- 8480 Island Pines Place
- 2798 Millstone Ct
- 7872 Hackney Cir
- 7846 Hackney Cir
- 3184 Red Brick Ct
- 2280 Bridle Ct
- 2491 Old Mill Rd
- 8582 Southland Dr
- 8730 Exeter Place
- 7838 Carraway Ct
- 3464 Simpson Trace
- 8846 Morley Place
- 3301 Crescent Falls Way
- 3244 Grand Falls Blvd Unit 33I
- 3232 Grand Falls Blvd Unit 33F
- 3414 Hidden Falls Ct
- 3432 Hidden Falls Ct
- 2845 E Cove Ct
- 2800 E Cove Ln
- 2829 E Cove Ct Unit E
- 2875 E Cove Ln
- 2875 E Cove Ct
- 2844 E Cove Ct
- 2830 E Cove Ct
- 2866 E Cove Ct
- 2811 E Cove Ct
- 2880 E Cove Ct
- 2895 E Cove Ln
- 2810 E Cove Ct
- 2856 E Cove Ct
- 2822 E Cove Ct
- 2858 E Cove Ct
- 2800 E Cove Ct
- 2801 E Cove Ct
- 2820 E Cove Ct
- 2909 E Cove Ct
- 2890 E Cove Ct
Your Personal Tour Guide
Ask me questions while you tour the home.