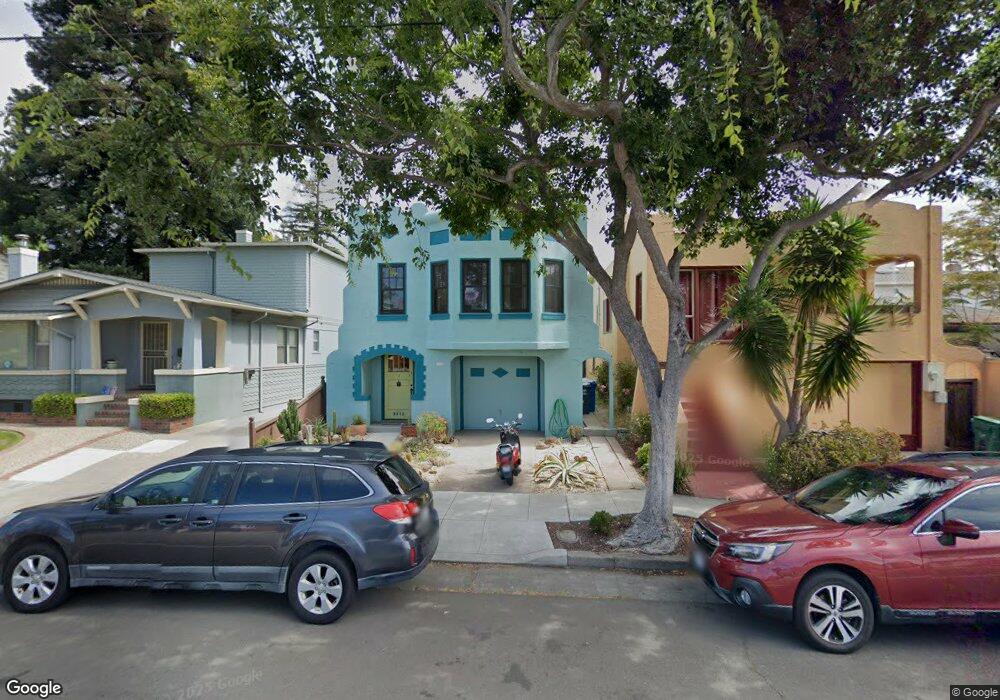
2845 Encinal Ave Alameda, CA 94501
Downtown Alameda NeighborhoodEstimated Value: $1,172,000 - $1,753,000
2
Beds
2
Baths
1,877
Sq Ft
$746/Sq Ft
Est. Value
About This Home
This home is located at 2845 Encinal Ave, Alameda, CA 94501 and is currently estimated at $1,399,313, approximately $745 per square foot. 2845 Encinal Ave is a home located in Alameda County with nearby schools including Frank Otis Elementary School, Lincoln Middle School, and Alameda High School.
Ownership History
Date
Name
Owned For
Owner Type
Purchase Details
Closed on
Feb 15, 2022
Sold by
Ruff Richard W and Ruff Amy D
Bought by
Richard And Amy Ruff Family Tr
Current Estimated Value
Purchase Details
Closed on
Aug 3, 2010
Sold by
Mcginty Michael P and Baker Allison L
Bought by
Ruff Richard W and Ruff Amy D
Home Financials for this Owner
Home Financials are based on the most recent Mortgage that was taken out on this home.
Original Mortgage
$510,400
Interest Rate
4.51%
Mortgage Type
New Conventional
Purchase Details
Closed on
May 1, 2002
Sold by
Hyman Sally Ann and Dragge Robert Carlyle
Bought by
Mcginty Michael P and Baker Allison L
Home Financials for this Owner
Home Financials are based on the most recent Mortgage that was taken out on this home.
Original Mortgage
$378,000
Interest Rate
6.54%
Create a Home Valuation Report for This Property
The Home Valuation Report is an in-depth analysis detailing your home's value as well as a comparison with similar homes in the area
Home Values in the Area
Average Home Value in this Area
Purchase History
| Date | Buyer | Sale Price | Title Company |
|---|---|---|---|
| Richard And Amy Ruff Family Tr | -- | Law Offices Of Kimberly C Vaug | |
| Ruff Richard W | $638,000 | Fidelity National Title Co | |
| Mcginty Michael P | $420,000 | North American Title Co |
Source: Public Records
Mortgage History
| Date | Status | Borrower | Loan Amount |
|---|---|---|---|
| Previous Owner | Ruff Richard W | $510,400 | |
| Previous Owner | Mcginty Michael P | $378,000 |
Source: Public Records
Tax History
| Year | Tax Paid | Tax Assessment Tax Assessment Total Assessment is a certain percentage of the fair market value that is determined by local assessors to be the total taxable value of land and additions on the property. | Land | Improvement |
|---|---|---|---|---|
| 2025 | $11,875 | $810,341 | $245,202 | $572,139 |
| 2024 | $11,875 | $794,321 | $240,396 | $560,925 |
| 2023 | $11,426 | $785,613 | $235,684 | $549,929 |
| 2022 | $11,174 | $763,211 | $231,063 | $539,148 |
| 2021 | $10,902 | $748,110 | $226,533 | $528,577 |
| 2020 | $10,772 | $747,371 | $224,211 | $523,160 |
| 2019 | $10,189 | $732,723 | $219,817 | $512,906 |
| 2018 | $9,935 | $718,361 | $215,508 | $502,853 |
| 2017 | $9,478 | $704,281 | $211,284 | $492,997 |
| 2016 | $9,493 | $690,474 | $207,142 | $483,332 |
| 2015 | $9,464 | $680,107 | $204,032 | $476,075 |
| 2014 | $9,030 | $666,785 | $200,035 | $466,750 |
Source: Public Records
Map
Nearby Homes
- 1308 Court St
- 2608 Central Ave
- 3248 Briggs Ave
- 1241 Park Ave
- 2417 Marti Rae Ct
- 1601 Broadway Unit 9
- 1100 Park Ave
- 1251 Park St
- 2312 San Antonio Ave
- 976 Park St
- 954 Park St
- 2214 Clinton Ave
- 2200 San Jose Ave
- 2932 Marina Dr
- 2959 Sea View Pkwy
- 405 Centre Ct
- 608 Centre Ct
- 2137 Otis Dr Unit 111
- 641 Centre Ct
- 632 Centre Ct Unit 48
- 2847 Encinal Ave
- 2841 Encinal Ave
- 2837 Encinal Ave
- 1305 Mound St
- 1309 Mound St
- 1313 Mound St
- 1301 Mound St
- 2835 Encinal Ave
- 1315 Mound St
- 1304 Grove St
- 2850 Jackson St
- 1308 Grove St
- 2852 Jackson St
- 1314 Grove St
- 2854 Jackson St
- 1300 Grove St
- 2844 Encinal Ave
- 2842 Jackson St
- 2848 Encinal Ave
- 2856 Jackson St
Your Personal Tour Guide
Ask me questions while you tour the home.