Estimated Value: $393,074 - $445,000
4
Beds
4
Baths
2,586
Sq Ft
$165/Sq Ft
Est. Value
About This Home
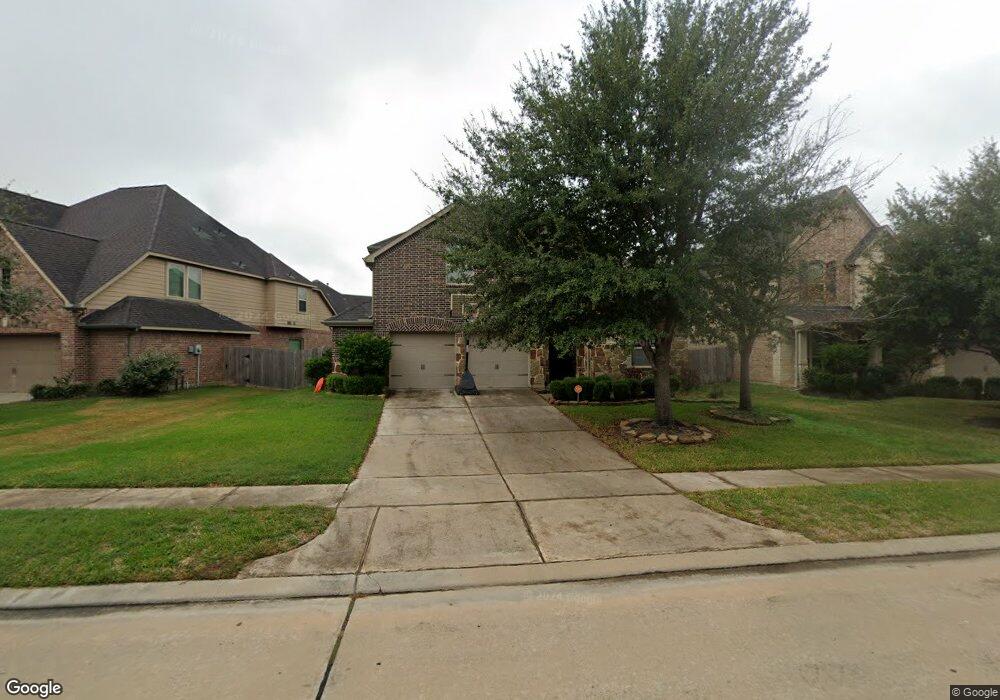
This home is located at 2846 Park Hills Dr, Katy, TX 77450 and is currently estimated at $426,769, approximately $165 per square foot. 2846 Park Hills Dr is a home located in Fort Bend County with nearby schools including Kathleen Joerger Lindsey Elementary School, Dean Leaman Junior High School, and Fulshear High School.
Ownership History
Date
Name
Owned For
Owner Type
Purchase Details
Closed on
Aug 3, 2016
Sold by
Wilkerson Jared Aaron and Wilkerson Stacy
Bought by
Felix Paul and Felix Sara
Current Estimated Value
Home Financials for this Owner
Home Financials are based on the most recent Mortgage that was taken out on this home.
Original Mortgage
$204,000
Outstanding Balance
$163,187
Interest Rate
3.56%
Mortgage Type
New Conventional
Estimated Equity
$263,582
Purchase Details
Closed on
Aug 20, 2013
Sold by
Highland Homes Houston Ltd
Bought by
Wilkerson Jared Aaron and Wilkerson Stacy
Home Financials for this Owner
Home Financials are based on the most recent Mortgage that was taken out on this home.
Original Mortgage
$210,650
Interest Rate
4.53%
Mortgage Type
New Conventional
Purchase Details
Closed on
Dec 6, 2012
Sold by
Jdc Firethorne Ltd
Bought by
Highland Homes Houston Ltd
Create a Home Valuation Report for This Property
The Home Valuation Report is an in-depth analysis detailing your home's value as well as a comparison with similar homes in the area
Home Values in the Area
Average Home Value in this Area
Purchase History
| Date | Buyer | Sale Price | Title Company |
|---|---|---|---|
| Felix Paul | -- | Stewart Title | |
| Wilkerson Jared Aaron | -- | None Available | |
| Felix Paul | -- | -- | |
| Highland Homes Houston Ltd | -- | None Available | |
| Felix Paul | -- | -- |
Source: Public Records
Mortgage History
| Date | Status | Borrower | Loan Amount |
|---|---|---|---|
| Open | Felix Paul | $204,000 | |
| Previous Owner | Felix Paul | $210,650 |
Source: Public Records
Tax History Compared to Growth
Tax History
| Year | Tax Paid | Tax Assessment Tax Assessment Total Assessment is a certain percentage of the fair market value that is determined by local assessors to be the total taxable value of land and additions on the property. | Land | Improvement |
|---|---|---|---|---|
| 2025 | $7,532 | $405,258 | $67,600 | $337,658 |
| 2024 | $7,532 | $383,268 | $47,364 | $335,904 |
| 2023 | $6,935 | $405,828 | $49,400 | $356,428 |
| 2022 | $9,560 | $375,920 | $49,400 | $326,520 |
| 2021 | $7,443 | $287,950 | $49,400 | $238,550 |
| 2020 | $7,342 | $281,040 | $49,400 | $231,640 |
| 2019 | $7,425 | $264,800 | $40,000 | $224,800 |
| 2018 | $7,441 | $263,020 | $40,000 | $223,020 |
| 2017 | $7,626 | $266,260 | $40,000 | $226,260 |
| 2016 | $7,796 | $272,200 | $40,000 | $232,200 |
| 2015 | $4,123 | $251,310 | $40,000 | $211,310 |
| 2014 | $3,871 | $228,460 | $40,000 | $188,460 |
Source: Public Records
Map
Nearby Homes
- 2851 Park Hills Dr
- 28919 Crested Butte Dr
- 2843 Mcdonough Way
- 2907 Isla Gorge Ct
- 28915 Davenport Dr
- 28814 Davenport Dr
- 2818 Mcdonough Way
- 29011 Oldfield Ct
- 29018 Pinnacle Ridge Dr
- 29003 Jacobs River Dr
- 28606 Wing Elm Dr
- 2718 Misty Laurel Ct
- 29014 Jacobs River Dr
- 29011 Erica Lee Ct
- 28710 Fitzroy Harbour
- 28918 Hollycrest Dr
- 29046 Davenport Dr
- 28622 Blue Holly Ln
- 28514 Rock Wren Ct
- 29110 Davenport Dr
- 2850 Park Hills Dr
- 2842 Park Hills Dr
- 28835 Thornbird Ct
- 2838 Park Hills Dr
- 2854 Park Hills Dr
- 28839 Thornbird Ct
- 28827 Thornbird Ct
- 2847 Park Hills Dr
- 2858 Park Hills Dr
- 2843 Park Hills Dr
- 28714 Park Hills Ct
- 2855 Park Hills Dr
- 28710 Park Hills Ct
- 2839 Park Hills Dr
- 28842 Thornbird Ct
- 28802 Crested Butte Dr
- 28806 Crested Butte Dr
- 28807 Pine Grove Ct
- 28715 Park Hills Ct
- 2831 Park Hills Dr