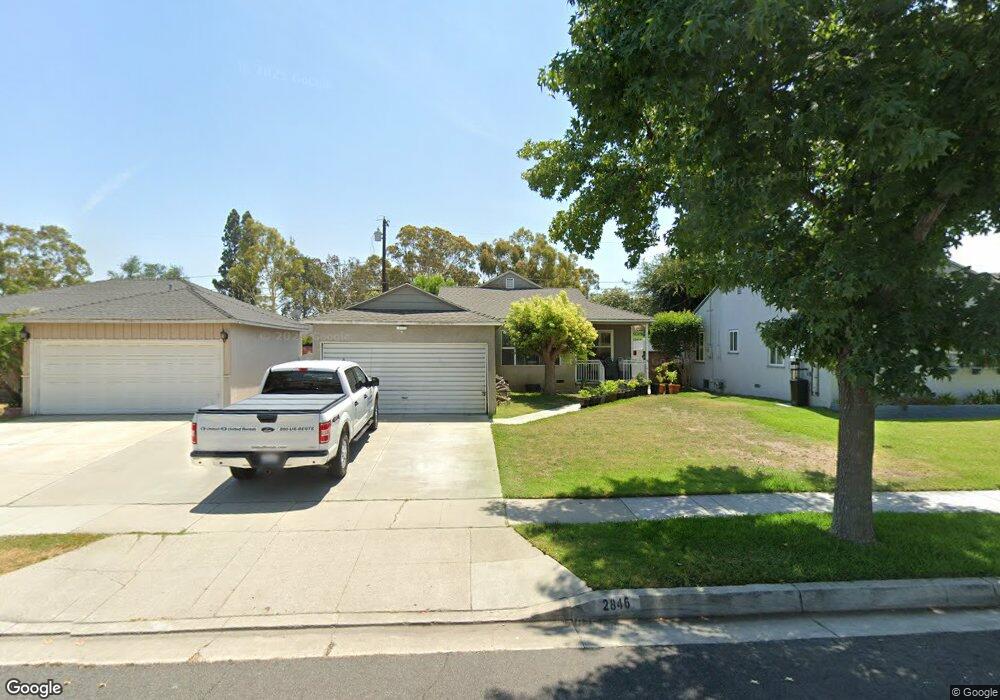
2846 Silva St Lakewood, CA 90712
Lakewood Mutual NeighborhoodEstimated Value: $820,000 - $972,000
3
Beds
2
Baths
1,574
Sq Ft
$570/Sq Ft
Est. Value
About This Home
This home is located at 2846 Silva St, Lakewood, CA 90712 and is currently estimated at $896,492, approximately $569 per square foot. 2846 Silva St is a home located in Los Angeles County with nearby schools including Holmes Elementary School, Hoover Middle School, and Lakewood High School.
Ownership History
Date
Name
Owned For
Owner Type
Purchase Details
Closed on
Jan 12, 2010
Sold by
Dingeman Kelly W and Dingeman Velma L
Bought by
Dingeman Kelly W and Dingeman Velma L
Current Estimated Value
Purchase Details
Closed on
Mar 5, 1996
Sold by
Federal National Mortgage Association
Bought by
Dingeman Kelly W and Dingeman Velma L
Home Financials for this Owner
Home Financials are based on the most recent Mortgage that was taken out on this home.
Original Mortgage
$113,400
Outstanding Balance
$4,427
Interest Rate
6.98%
Mortgage Type
Seller Take Back
Estimated Equity
$892,065
Purchase Details
Closed on
Jun 8, 1995
Sold by
Johnson Dawn and Johnson Rachel
Bought by
Federal National Mortgage Association
Purchase Details
Closed on
Mar 2, 1995
Sold by
Johnson Dawn
Bought by
Johnson Rachel
Create a Home Valuation Report for This Property
The Home Valuation Report is an in-depth analysis detailing your home's value as well as a comparison with similar homes in the area
Home Values in the Area
Average Home Value in this Area
Purchase History
| Date | Buyer | Sale Price | Title Company |
|---|---|---|---|
| Dingeman Kelly W | -- | None Available | |
| Dingeman Kelly W | $133,500 | North American Title Co | |
| Federal National Mortgage Association | $151,817 | First Southwestern Title | |
| Johnson Rachel | -- | -- |
Source: Public Records
Mortgage History
| Date | Status | Borrower | Loan Amount |
|---|---|---|---|
| Open | Dingeman Kelly W | $113,400 |
Source: Public Records
Tax History Compared to Growth
Tax History
| Year | Tax Paid | Tax Assessment Tax Assessment Total Assessment is a certain percentage of the fair market value that is determined by local assessors to be the total taxable value of land and additions on the property. | Land | Improvement |
|---|---|---|---|---|
| 2025 | $4,206 | $295,594 | $170,597 | $124,997 |
| 2024 | $4,206 | $289,799 | $167,252 | $122,547 |
| 2023 | $4,136 | $284,118 | $163,973 | $120,145 |
| 2022 | $3,896 | $278,548 | $160,758 | $117,790 |
| 2021 | $3,813 | $273,087 | $157,606 | $115,481 |
| 2019 | $3,757 | $264,988 | $152,932 | $112,056 |
| 2018 | $3,608 | $259,793 | $149,934 | $109,859 |
| 2016 | $3,320 | $249,707 | $144,113 | $105,594 |
| 2015 | $3,196 | $245,957 | $141,949 | $104,008 |
| 2014 | $3,178 | $241,140 | $139,169 | $101,971 |
Source: Public Records
Map
Nearby Homes
- 2922 Eckleson St
- 2912 Yearling St
- 2918 Yearling St
- 2739 Denmead St
- 2523 Allred St
- 3244 Centralia St
- 4559 Levelside Ave
- 5450 N Paramount Blvd Unit 12
- 2803 Frankel St
- 2729 Greentop St
- 4944 Coke Ave
- 5500 Ackerfield Ave Unit 104
- 3638 Sandwood St
- 5530 Ackerfield Ave Unit 206
- 5535 Ackerfield Ave Unit 9
- 5602 Verdura Ave
- 4848 Oliva Ave
- 1921 E Washington St
- 4328 Deeboyar Ave
- 1648 E Plymouth St
- 2852 Silva St
- 2842 Silva St
- 2858 Silva St
- 2813 Del Amo Blvd
- 2836 Silva St
- 2807 Del Amo Blvd
- 2817 Del Amo Blvd
- 2823 Del Amo Blvd
- 2803 Del Amo Blvd
- 2862 Silva St
- 2847 Silva St
- 2851 Silva St
- 2843 Silva St
- 2827 Del Amo Blvd
- 2857 Silva St
- 2837 Silva St
- 2866 Silva St
- 2861 Silva St
- 2833 Del Amo Blvd
- 2819 Silva St