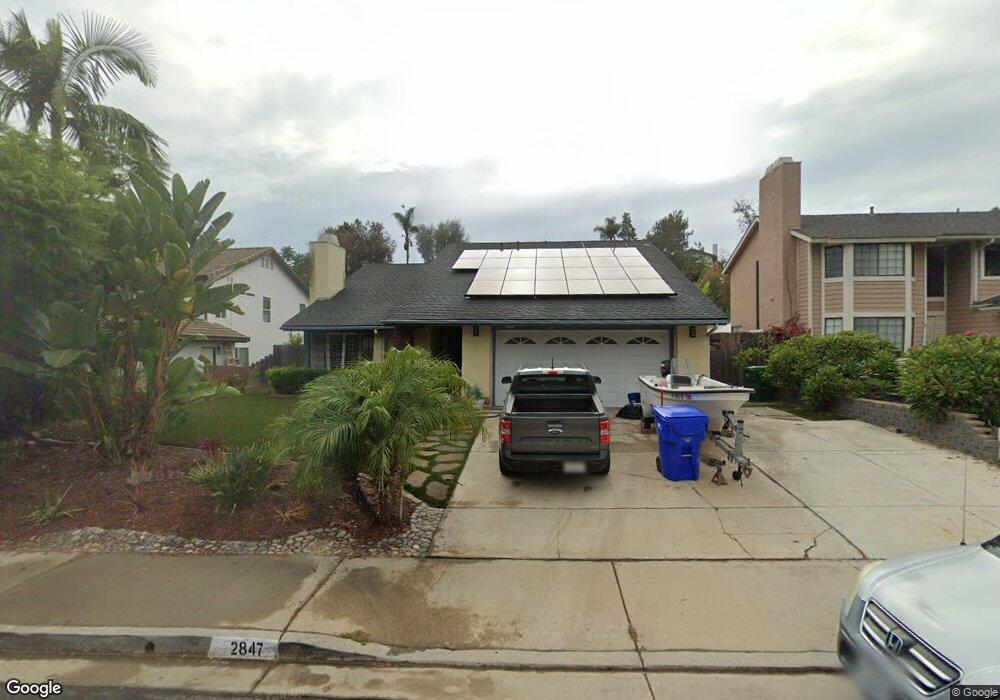
2847 Columbia Dr Oceanside, CA 92056
Mira Costa NeighborhoodEstimated Value: $927,590 - $1,154,000
4
Beds
2
Baths
1,595
Sq Ft
$624/Sq Ft
Est. Value
About This Home
This home is located at 2847 Columbia Dr, Oceanside, CA 92056 and is currently estimated at $994,648, approximately $623 per square foot. 2847 Columbia Dr is a home located in San Diego County with nearby schools including Christa McAuliffe Elementary School, Martin Luther King Jr. Middle School, and El Camino High School.
Ownership History
Date
Name
Owned For
Owner Type
Purchase Details
Closed on
Apr 10, 2024
Sold by
Johnson Debra R
Bought by
Debra Rose Johnson Trust and Johnson
Current Estimated Value
Purchase Details
Closed on
Jun 12, 2018
Sold by
Johnson Robert G and Johnson Debra R
Bought by
Johnson Debra R
Home Financials for this Owner
Home Financials are based on the most recent Mortgage that was taken out on this home.
Original Mortgage
$189,500
Interest Rate
4.6%
Mortgage Type
New Conventional
Purchase Details
Closed on
Sep 22, 1997
Sold by
Wearda Dean T and Wearda Marilyn N
Bought by
Johnson Robert G and Johnson Debra R
Home Financials for this Owner
Home Financials are based on the most recent Mortgage that was taken out on this home.
Original Mortgage
$157,700
Interest Rate
7.54%
Purchase Details
Closed on
Mar 31, 1989
Purchase Details
Closed on
Aug 17, 1987
Create a Home Valuation Report for This Property
The Home Valuation Report is an in-depth analysis detailing your home's value as well as a comparison with similar homes in the area
Home Values in the Area
Average Home Value in this Area
Purchase History
| Date | Buyer | Sale Price | Title Company |
|---|---|---|---|
| Debra Rose Johnson Trust | -- | None Listed On Document | |
| Johnson Debra R | -- | Title Source Inc | |
| Johnson Robert G | $166,000 | Fidelity National Title | |
| -- | $183,500 | -- | |
| -- | $126,400 | -- |
Source: Public Records
Mortgage History
| Date | Status | Borrower | Loan Amount |
|---|---|---|---|
| Previous Owner | Johnson Debra R | $189,500 | |
| Previous Owner | Johnson Robert G | $157,700 |
Source: Public Records
Tax History Compared to Growth
Tax History
| Year | Tax Paid | Tax Assessment Tax Assessment Total Assessment is a certain percentage of the fair market value that is determined by local assessors to be the total taxable value of land and additions on the property. | Land | Improvement |
|---|---|---|---|---|
| 2025 | $2,878 | $265,027 | $92,018 | $173,009 |
| 2024 | $2,878 | $259,831 | $90,214 | $169,617 |
| 2023 | $2,788 | $254,738 | $88,446 | $166,292 |
| 2022 | $2,744 | $249,744 | $86,712 | $163,032 |
| 2021 | $2,753 | $244,848 | $85,012 | $159,836 |
| 2020 | $2,669 | $242,339 | $84,141 | $158,198 |
| 2019 | $2,590 | $237,589 | $82,492 | $155,097 |
| 2018 | $2,562 | $232,931 | $80,875 | $152,056 |
| 2017 | $2,513 | $228,365 | $79,290 | $149,075 |
| 2016 | $2,430 | $223,888 | $77,736 | $146,152 |
| 2015 | $2,359 | $220,526 | $76,569 | $143,957 |
| 2014 | $2,268 | $216,208 | $75,070 | $141,138 |
Source: Public Records
Map
Nearby Homes
- 2102 Ramada Dr
- 2859 Rutgers Place
- 2858 Lehigh Ct
- 3432 Cameo Dr Unit 63
- 3432 Cameo Dr Unit 62
- 3424 Cameo Dr Unit 43
- 3726 Kelton Dr
- 2030 San Remo Dr
- 100 Sea Cliff Way Unit 104
- 3847 Cornell Dr
- 2130 Anda Lucia Way
- 3531 Cameo Dr Unit 99
- 2175 Castilla Way
- 2187 Castilla Way
- 2188 Anda Lucia Way
- 2315 Rancho Del Oro Rd Unit 14
- 3376 Corsica Way
- 3396 Corsica Way
- 3372 Corsica Way
- 3338 Par Dr
- 2851 Columbia Dr
- 2843 Columbia Dr
- 2855 Columbia Dr
- 2104 Ramada Dr
- 2106 Ramada Dr
- 2839 Columbia Dr
- 2108 Ramada Dr
- 2859 Columbia Dr
- 2110 Ramada Dr
- 2835 Columbia Dr
- 2112 Ramada Dr
- 2863 Columbia Dr
- 2851 Rutgers Place
- 2825 Brandeis Dr
- 2116 Ramada Dr
- 2847 Rutgers Place
- 3447 Vista Del Oro
- 2843 Rutgers Place
- 2867 Columbia Dr
- 2821 Brandeis Dr