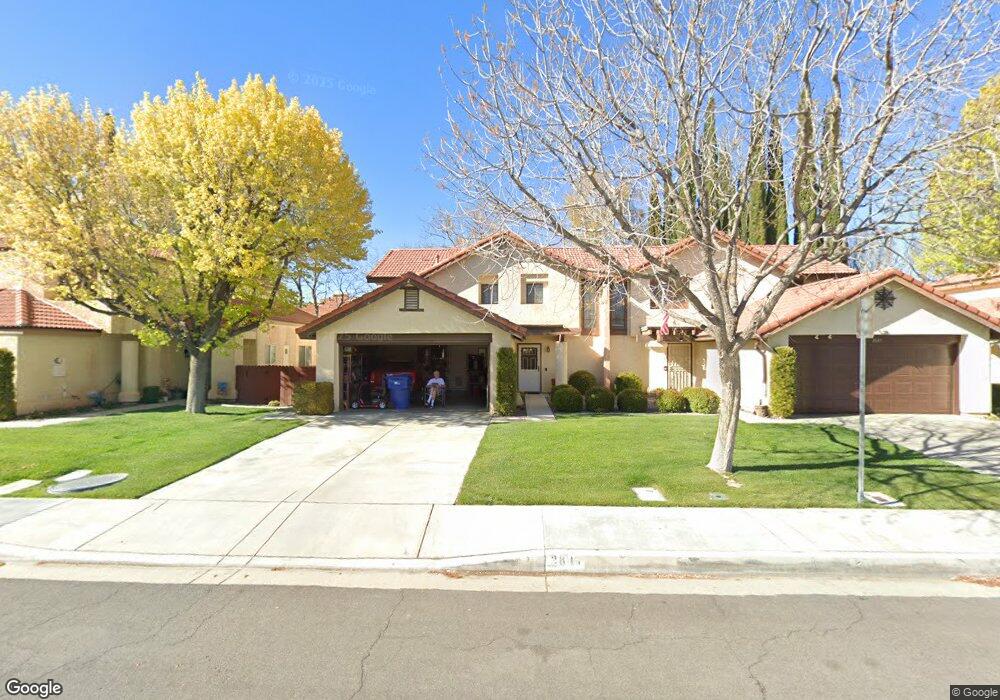
2847 Dartmouth Dr Lancaster, CA 93536
West Lancaster NeighborhoodEstimated Value: $390,000 - $404,000
3
Beds
3
Baths
1,452
Sq Ft
$273/Sq Ft
Est. Value
About This Home
This home is located at 2847 Dartmouth Dr, Lancaster, CA 93536 and is currently estimated at $396,468, approximately $273 per square foot. 2847 Dartmouth Dr is a home located in Los Angeles County with nearby schools including Miller Elementary School, Amargosa Creek Middle School, and Lancaster High School.
Ownership History
Date
Name
Owned For
Owner Type
Purchase Details
Closed on
Oct 25, 1999
Sold by
Lott David F
Bought by
Stevenson Lott Wendy S
Current Estimated Value
Home Financials for this Owner
Home Financials are based on the most recent Mortgage that was taken out on this home.
Original Mortgage
$97,750
Outstanding Balance
$29,492
Interest Rate
7.82%
Estimated Equity
$366,976
Purchase Details
Closed on
Oct 13, 1999
Sold by
Wilson Anita M
Bought by
Stevenson John F and Stevenson Lott Wendy S
Home Financials for this Owner
Home Financials are based on the most recent Mortgage that was taken out on this home.
Original Mortgage
$97,750
Outstanding Balance
$29,492
Interest Rate
7.82%
Estimated Equity
$366,976
Purchase Details
Closed on
Mar 7, 1997
Sold by
Fergione John A
Bought by
Fergione Anita M
Home Financials for this Owner
Home Financials are based on the most recent Mortgage that was taken out on this home.
Original Mortgage
$82,850
Interest Rate
7.66%
Mortgage Type
FHA
Create a Home Valuation Report for This Property
The Home Valuation Report is an in-depth analysis detailing your home's value as well as a comparison with similar homes in the area
Home Values in the Area
Average Home Value in this Area
Purchase History
| Date | Buyer | Sale Price | Title Company |
|---|---|---|---|
| Stevenson Lott Wendy S | -- | First American Title Co | |
| Stevenson John F | $103,000 | First American Title Co | |
| Fergione Anita M | -- | -- | |
| Fergione Anita M | $83,000 | -- |
Source: Public Records
Mortgage History
| Date | Status | Borrower | Loan Amount |
|---|---|---|---|
| Open | Stevenson John F | $97,750 | |
| Previous Owner | Fergione Anita M | $82,850 |
Source: Public Records
Tax History Compared to Growth
Tax History
| Year | Tax Paid | Tax Assessment Tax Assessment Total Assessment is a certain percentage of the fair market value that is determined by local assessors to be the total taxable value of land and additions on the property. | Land | Improvement |
|---|---|---|---|---|
| 2025 | $2,670 | $158,279 | $31,648 | $126,631 |
| 2024 | $2,670 | $155,177 | $31,028 | $124,149 |
| 2023 | $2,621 | $152,135 | $30,420 | $121,715 |
| 2022 | $2,913 | $149,153 | $29,824 | $119,329 |
| 2021 | $2,529 | $146,230 | $29,240 | $116,990 |
| 2019 | $2,460 | $141,895 | $28,374 | $113,521 |
| 2018 | $2,415 | $139,114 | $27,818 | $111,296 |
| 2016 | $2,290 | $133,714 | $26,739 | $106,975 |
| 2015 | $2,262 | $131,707 | $26,338 | $105,369 |
| 2014 | $2,132 | $129,128 | $25,823 | $103,305 |
Source: Public Records
Map
Nearby Homes
- 2825 Dartmouth Dr
- 2816 Dartmouth Dr
- 2856 Dartmouth Dr
- 2860 Dartmouth Dr
- 0 30 St W and Ave K4
- 2729 Parton Cir
- 43320 Yale Ct
- 43467 30th St W Unit 2
- 43335 Echard Ave
- 43327 Echard Ave
- 2646 Brentwood Dr
- 43455 30th St W Unit 4
- 43413 30th St W Unit 3
- 43220 Echard Ave
- 43334 32nd St W Unit 17
- 43334 32nd St W Unit 26
- 43334 32nd St W Unit 44
- 43208 Doverwood Ct
- 2843 Dartmouth Dr
- 2851 Dartmouth Dr
- 2855 Dartmouth Dr
- 2839 Dartmouth Dr
- 2842 W Avenue k4
- 2846 W Avenue k4
- 2850 W Avenue k4
- 2859 Dartmouth Dr
- 2835 Dartmouth Dr
- 2842 W Avenue K 4
- 2838 W Avenue k4
- 2854 W Avenue k4
- 2844 Dartmouth Dr
- 2858 W Avenue k4
- 2834 W Avenue k4
- 2848 Dartmouth Dr
- 2852 Dartmouth Dr
- 2862 W Avenue k4
- 2836 Dartmouth Dr
- 2856 2856 Dartmouth Dr