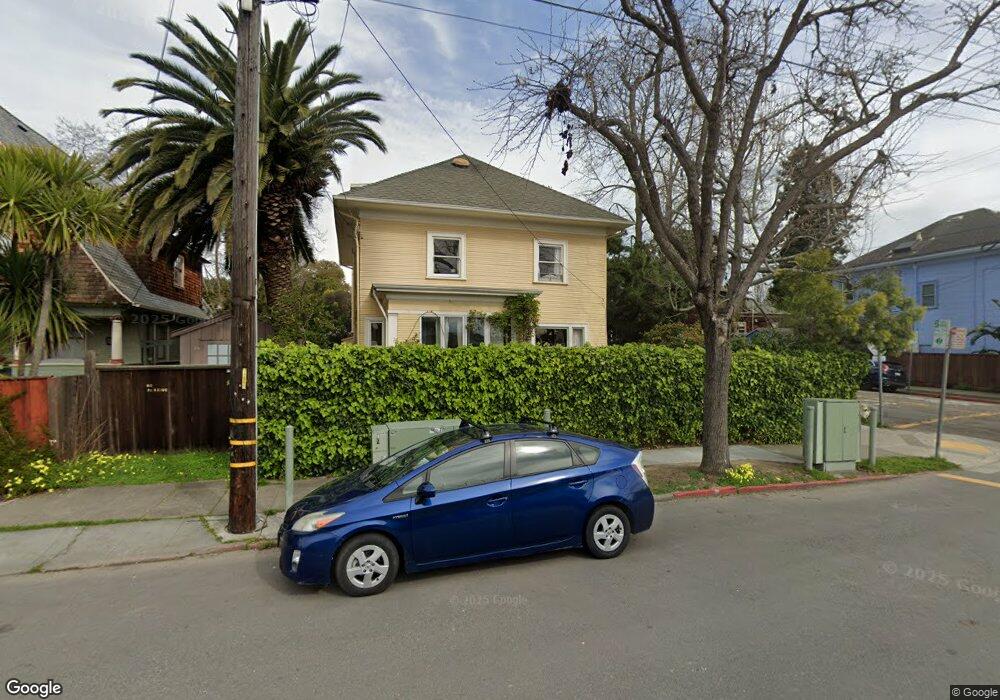
2847 Fulton St Berkeley, CA 94705
South Berkeley NeighborhoodEstimated Value: $948,000 - $1,644,000
Studio
--
Bath
1,700
Sq Ft
$727/Sq Ft
Est. Value
About This Home
This home is located at 2847 Fulton St, Berkeley, CA 94705 and is currently estimated at $1,236,709, approximately $727 per square foot. 2847 Fulton St is a home located in Alameda County with nearby schools including Malcolm X Elementary School, Emerson Elementary School, and John Muir Elementary School.
Ownership History
Date
Name
Owned For
Owner Type
Purchase Details
Closed on
Jan 31, 2012
Sold by
Fraser Robert Bruce and Odegard Djuna
Bought by
Fraser Robert B and Odegard Djuna
Current Estimated Value
Purchase Details
Closed on
Sep 25, 2003
Sold by
Cooke Brian L and Brian L & Teresa Morrone Trust
Bought by
Cooke Brian L and Brian L & Teresa Morrone Trust
Purchase Details
Closed on
Nov 18, 2002
Sold by
Cooke Brian L and Morrone Teresa
Bought by
Cooke Brian L and Morrone Teresa
Purchase Details
Closed on
May 3, 2001
Sold by
Cooke Brian L and Morrone Teresa
Bought by
Cooke Brian L and Morrone Teresa
Purchase Details
Closed on
May 29, 1998
Sold by
Cooke Brian L and Morrone Teresa
Bought by
Cooke Brian L and Morrone Teresa
Purchase Details
Closed on
Aug 15, 1996
Sold by
Sneider Cary Ivan
Bought by
Sneider Cary Ivan and Carter Elizabeth Ellen
Create a Home Valuation Report for This Property
The Home Valuation Report is an in-depth analysis detailing your home's value as well as a comparison with similar homes in the area
Home Values in the Area
Average Home Value in this Area
Purchase History
| Date | Buyer | Sale Price | Title Company |
|---|---|---|---|
| Fraser Robert B | -- | None Available | |
| Cooke Brian L | -- | -- | |
| Cooke Brian L | -- | Old Republic Title Company | |
| Cooke Brian L | -- | -- | |
| Cooke Brian L | $15,000 | -- | |
| Sneider Cary Ivan | -- | -- |
Source: Public Records
Tax History
| Year | Tax Paid | Tax Assessment Tax Assessment Total Assessment is a certain percentage of the fair market value that is determined by local assessors to be the total taxable value of land and additions on the property. | Land | Improvement |
|---|---|---|---|---|
| 2025 | $8,734 | $398,242 | $120,548 | $284,694 |
| 2024 | $8,734 | $390,297 | $118,185 | $279,112 |
| 2023 | $8,472 | $389,508 | $115,868 | $273,640 |
| 2022 | $8,212 | $374,871 | $113,596 | $268,275 |
| 2021 | $8,196 | $367,384 | $111,369 | $263,015 |
| 2020 | $7,675 | $370,546 | $110,227 | $260,319 |
| 2019 | $7,272 | $363,282 | $108,066 | $255,216 |
| 2018 | $7,111 | $356,161 | $105,948 | $250,213 |
| 2017 | $6,838 | $349,178 | $103,871 | $245,307 |
| 2016 | $6,535 | $342,332 | $101,834 | $240,498 |
| 2015 | $6,429 | $337,191 | $100,305 | $236,886 |
| 2014 | $6,431 | $330,587 | $98,340 | $232,247 |
Source: Public Records
Map
Nearby Homes
- 2923 Wheeler St
- 2110 Ashby Ave
- 2243 Ashby Ave
- 2057 Emerson St
- 3046 Deakin St
- 2124 Prince St
- 2917 Telegraph Ave
- 2319 Ward St
- 2935 Florence St
- 629 66th St
- 2702 Dana St
- 6555 Shattuck Ave
- 6445 Irwin Ct
- 2018 Blake St
- 556 Alcatraz Ave
- 6446 Colby St
- 2550 Dana St Unit 2F
- 2477 Prince St
- 667 & 667A Alcatraz Ave
- 667 Alcatraz Ave
- 2843 Fulton St
- 2207 Russell St
- 2837 Fulton St
- 2901 Fulton St
- 2210 Russell St
- 2846 Fulton St
- 2842 Fulton St
- 2907 Fulton St
- 2212 Russell St
- 2154 Russell St
- 2214 Russell St
- 2838 Fulton St
- 2153 Russell St
- 2152 Russell St
- 2911 Fulton St
- 2832 Fulton St
- 2828 Fulton St
- 2218 Russell St
- 2906 Deakin St
- 2150 Russell St
Your Personal Tour Guide
Ask me questions while you tour the home.