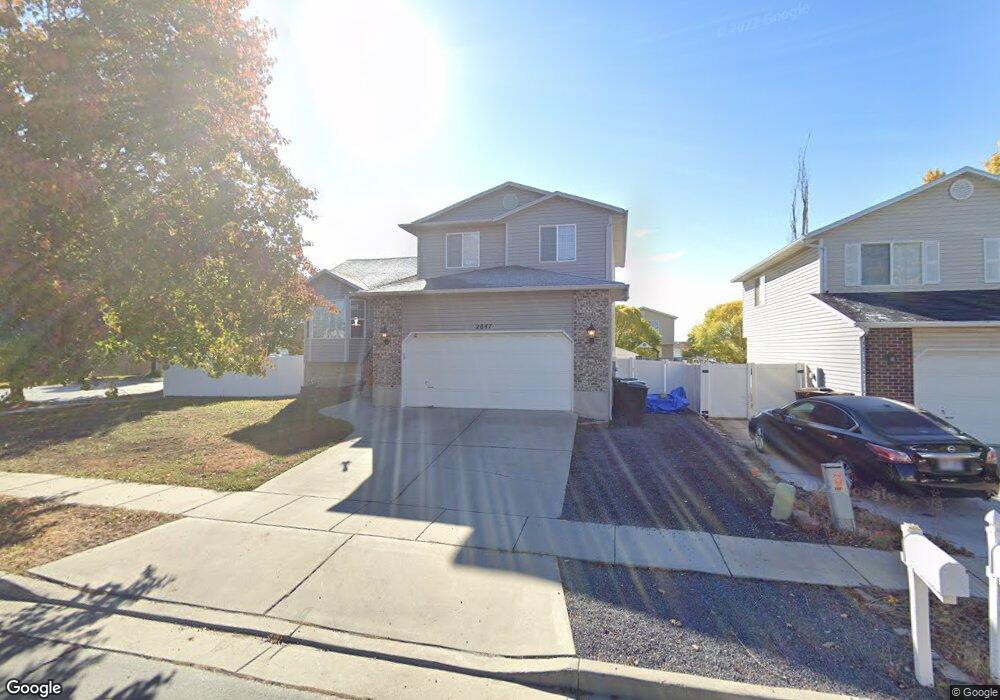
2847 W 2175 S Syracuse, UT 84075
Estimated Value: $479,000 - $503,558
5
Beds
3
Baths
2,145
Sq Ft
$229/Sq Ft
Est. Value
About This Home
This home is located at 2847 W 2175 S, Syracuse, UT 84075 and is currently estimated at $491,640, approximately $229 per square foot. 2847 W 2175 S is a home located in Davis County with nearby schools including Buffalo Point School, Syracuse Junior High School, and Syracuse High School.
Ownership History
Date
Name
Owned For
Owner Type
Purchase Details
Closed on
Aug 20, 2007
Sold by
Wells Jeremy W
Bought by
Mogg Andrew J
Current Estimated Value
Home Financials for this Owner
Home Financials are based on the most recent Mortgage that was taken out on this home.
Original Mortgage
$174,400
Outstanding Balance
$110,816
Interest Rate
6.73%
Mortgage Type
Purchase Money Mortgage
Estimated Equity
$380,824
Purchase Details
Closed on
Jun 8, 2005
Sold by
Tolman Travis M and Tolman Danielle D
Bought by
Wells Jeremy W
Home Financials for this Owner
Home Financials are based on the most recent Mortgage that was taken out on this home.
Original Mortgage
$166,000
Interest Rate
5.37%
Mortgage Type
Fannie Mae Freddie Mac
Purchase Details
Closed on
Jul 23, 2001
Sold by
Woodside Homes Corp
Bought by
Tolman Travis M and Tolman Danielle D
Home Financials for this Owner
Home Financials are based on the most recent Mortgage that was taken out on this home.
Original Mortgage
$134,570
Interest Rate
7.15%
Mortgage Type
FHA
Create a Home Valuation Report for This Property
The Home Valuation Report is an in-depth analysis detailing your home's value as well as a comparison with similar homes in the area
Home Values in the Area
Average Home Value in this Area
Purchase History
| Date | Buyer | Sale Price | Title Company |
|---|---|---|---|
| Mogg Andrew J | -- | First American Title | |
| Wells Jeremy W | -- | First American Title | |
| Tolman Travis M | -- | First American Title Co |
Source: Public Records
Mortgage History
| Date | Status | Borrower | Loan Amount |
|---|---|---|---|
| Open | Mogg Andrew J | $174,400 | |
| Previous Owner | Wells Jeremy W | $166,000 | |
| Previous Owner | Tolman Travis M | $134,570 |
Source: Public Records
Tax History
| Year | Tax Paid | Tax Assessment Tax Assessment Total Assessment is a certain percentage of the fair market value that is determined by local assessors to be the total taxable value of land and additions on the property. | Land | Improvement |
|---|---|---|---|---|
| 2025 | $2,525 | $243,650 | $97,754 | $145,896 |
| 2024 | $2,548 | $247,499 | $73,960 | $173,539 |
| 2023 | $2,367 | $230,450 | $64,441 | $166,008 |
| 2022 | $2,573 | $454,000 | $102,408 | $351,592 |
| 2021 | $2,250 | $338,000 | $82,406 | $255,594 |
| 2020 | $1,974 | $287,000 | $63,930 | $223,070 |
| 2019 | $1,902 | $273,000 | $68,871 | $204,129 |
| 2018 | $1,783 | $254,000 | $67,839 | $186,161 |
| 2016 | $1,529 | $114,236 | $29,618 | $84,618 |
| 2015 | $1,498 | $106,646 | $29,618 | $77,028 |
| 2014 | $1,413 | $102,487 | $29,618 | $72,869 |
| 2013 | -- | $99,609 | $25,850 | $73,759 |
Source: Public Records
Map
Nearby Homes
- 2803 W 2025 S
- 2961 S 2425 W Unit 1123
- 2376 S 2885 W
- 2696 2495 S Unit 207
- 2971 S 2425 W Unit 1124
- 3062 W Solace St
- 2635 S 2430 W Unit 114
- 2982 S 3000 W
- 2475 Craig Ln
- 2423 S 3300 W
- 2188 S 2325 W
- 2679 W Antelope Dr
- 2735 S Shoreline Dr
- 2574 S 2430 W Unit 503
- 2594 S 2430 W Unit 501
- 4344 W 1825 S Unit 102
- 4354 W 1825 S Unit 104
- 2666 S 2430 W Unit 103
- 2653 S 2430 W Unit 115
- 2329 W 1700 S
Your Personal Tour Guide
Ask me questions while you tour the home.