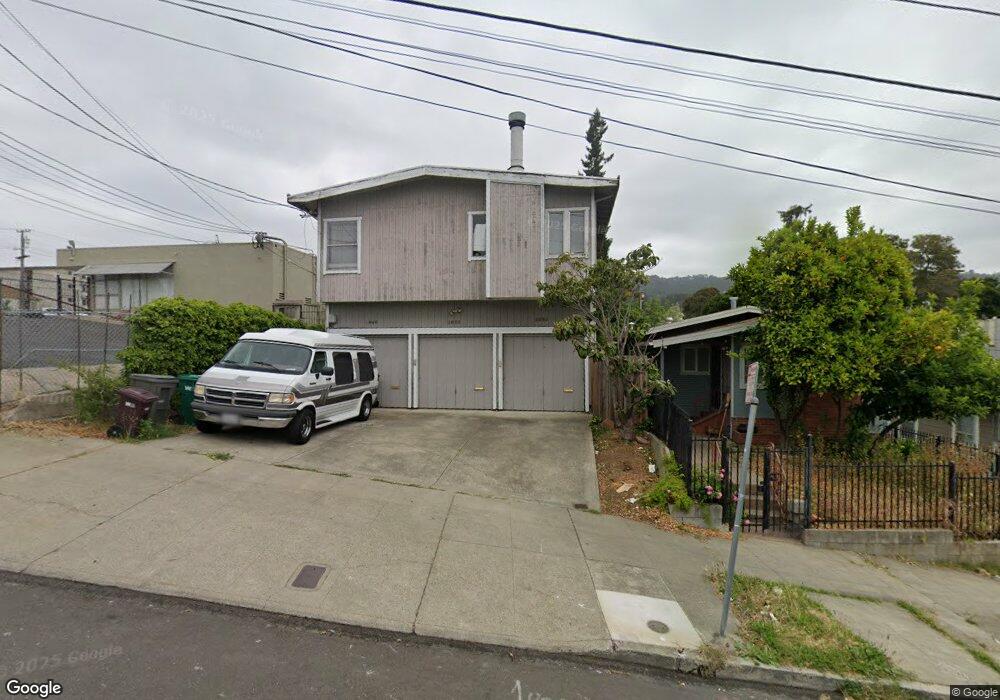
2848 Georgia St Unit U3 Oakland, CA 94602
Dimond District NeighborhoodEstimated Value: $366,000 - $527,000
3
Beds
2
Baths
1,061
Sq Ft
$440/Sq Ft
Est. Value
About This Home
This home is located at 2848 Georgia St Unit U3, Oakland, CA 94602 and is currently estimated at $467,065, approximately $440 per square foot. 2848 Georgia St Unit U3 is a home located in Alameda County with nearby schools including Fruitvale Elementary School, Bret Harte Middle School, and Skyline High School.
Ownership History
Date
Name
Owned For
Owner Type
Purchase Details
Closed on
Jun 15, 2007
Sold by
Corr Carol D
Bought by
Jones Melissa M
Current Estimated Value
Home Financials for this Owner
Home Financials are based on the most recent Mortgage that was taken out on this home.
Original Mortgage
$12,500
Outstanding Balance
$7,636
Interest Rate
6.16%
Mortgage Type
Stand Alone Second
Estimated Equity
$459,429
Purchase Details
Closed on
Nov 21, 1995
Sold by
Va
Bought by
Young Barry Alan
Home Financials for this Owner
Home Financials are based on the most recent Mortgage that was taken out on this home.
Original Mortgage
$90,750
Interest Rate
7.47%
Mortgage Type
FHA
Purchase Details
Closed on
Oct 13, 1994
Sold by
Norwest Mtg Inc
Bought by
Va
Purchase Details
Closed on
Oct 11, 1994
Sold by
Norwest Mtg Inc
Bought by
Norwest Mtg Inc
Create a Home Valuation Report for This Property
The Home Valuation Report is an in-depth analysis detailing your home's value as well as a comparison with similar homes in the area
Home Values in the Area
Average Home Value in this Area
Purchase History
| Date | Buyer | Sale Price | Title Company |
|---|---|---|---|
| Jones Melissa M | $308,000 | Chicago Title Co | |
| Young Barry Alan | $95,500 | North American Title Co | |
| Va | -- | -- | |
| Norwest Mtg Inc | $91,918 | -- |
Source: Public Records
Mortgage History
| Date | Status | Borrower | Loan Amount |
|---|---|---|---|
| Open | Jones Melissa M | $12,500 | |
| Previous Owner | Young Barry Alan | $90,750 |
Source: Public Records
Tax History Compared to Growth
Tax History
| Year | Tax Paid | Tax Assessment Tax Assessment Total Assessment is a certain percentage of the fair market value that is determined by local assessors to be the total taxable value of land and additions on the property. | Land | Improvement |
|---|---|---|---|---|
| 2025 | $7,058 | $405,621 | $123,786 | $288,835 |
| 2024 | $7,058 | $397,533 | $121,360 | $283,173 |
| 2023 | $7,220 | $396,601 | $118,980 | $277,621 |
| 2022 | $7,271 | $381,827 | $116,648 | $272,179 |
| 2021 | $7,937 | $374,204 | $114,361 | $266,843 |
| 2020 | $6,807 | $377,296 | $113,189 | $264,107 |
| 2019 | $8,856 | $369,901 | $110,970 | $258,931 |
| 2018 | $6,249 | $362,651 | $108,795 | $253,856 |
| 2017 | $5,779 | $355,542 | $106,662 | $248,880 |
| 2016 | $5,162 | $320,000 | $96,000 | $224,000 |
| 2015 | $5,400 | $300,000 | $90,000 | $210,000 |
| 2014 | $4,481 | $230,000 | $69,000 | $161,000 |
Source: Public Records
Map
Nearby Homes
- 2715 Macarthur Blvd
- 2958 Georgia St
- 2954 Delaware St
- 3316 Coolidge Ave
- 2726 Madeline St
- 3019 Florida St
- 2941 Madeline St
- 3055 Kansas St
- 3853 Rhoda Ave
- 3477 Boston Ave Unit 4
- 3873 Coolidge Ave
- 3120 School St
- 3875 Coolidge Ave
- 3288 School St
- 2808 Carmel St
- 3137 Pleitner Ave
- 3134 Pleitner Ave
- 3826 Lincoln Ave
- 2510 Delmer St
- 3243 Madeline St
- 2850 Georgia St
- 2852 Georgia St Unit U1
- 2856 Georgia St
- 2862 Georgia St
- 2888 Georgia St
- 2868 Georgia St
- 2874 Georgia St
- 2841 Macarthur Blvd
- 2853 Macarthur Blvd
- 2882 Georgia St
- 2861 Macarthur Blvd
- 2849 Georgia St
- 2857 Georgia St
- 2863 Georgia St
- 2886 Georgia St
- 2835 Georgia St
- 2875 Georgia St
- 2867 Macarthur Blvd
- 2833 Georgia St
- 2900 Georgia St