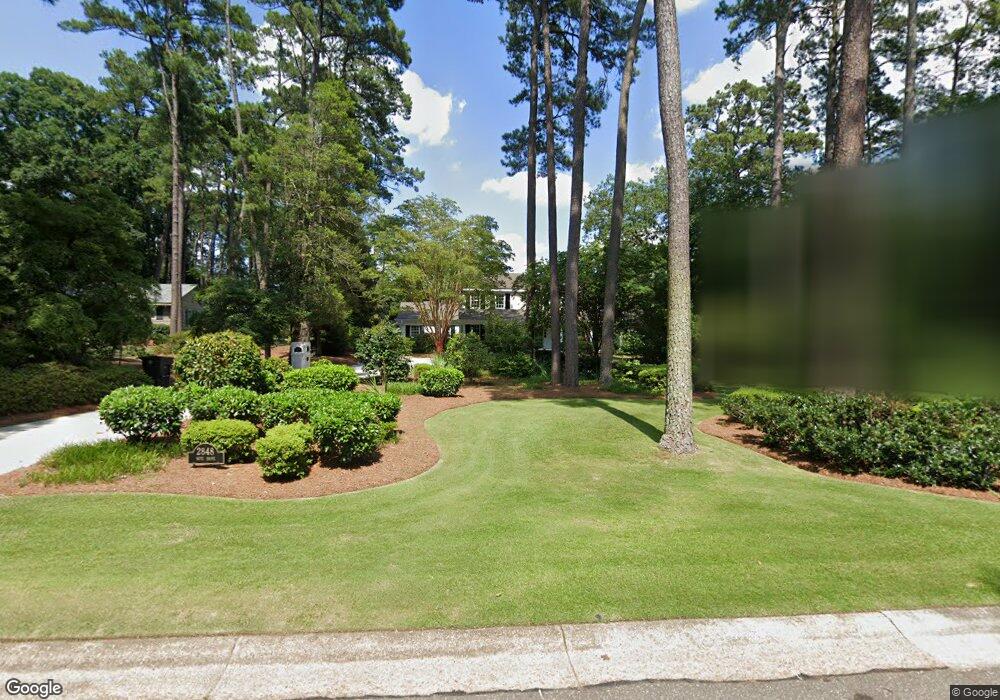
2848 Skye Dr Fayetteville, NC 28303
Terry Sanford NeighborhoodEstimated Value: $756,000 - $1,309,000
4
Beds
7
Baths
7,206
Sq Ft
$152/Sq Ft
Est. Value
About This Home
This home is located at 2848 Skye Dr, Fayetteville, NC 28303 and is currently estimated at $1,094,164, approximately $151 per square foot. 2848 Skye Dr is a home located in Cumberland County with nearby schools including Vanstory Hills Elementary School, Alma O Easom Elementary, and R. Max Abbott Middle School.
Ownership History
Date
Name
Owned For
Owner Type
Purchase Details
Closed on
Oct 20, 2009
Sold by
Highland Dev Partners
Bought by
Summerlyn Invests Of Fayettevi
Current Estimated Value
Home Financials for this Owner
Home Financials are based on the most recent Mortgage that was taken out on this home.
Original Mortgage
$86,600
Outstanding Balance
$56,462
Interest Rate
5.05%
Mortgage Type
New Conventional
Estimated Equity
$1,037,702
Create a Home Valuation Report for This Property
The Home Valuation Report is an in-depth analysis detailing your home's value as well as a comparison with similar homes in the area
Home Values in the Area
Average Home Value in this Area
Purchase History
| Date | Buyer | Sale Price | Title Company |
|---|---|---|---|
| Summerlyn Invests Of Fayettevi | $744,000 | -- |
Source: Public Records
Mortgage History
| Date | Status | Borrower | Loan Amount |
|---|---|---|---|
| Open | Summerlyn Invests Of Fayettevi | $86,600 |
Source: Public Records
Tax History Compared to Growth
Tax History
| Year | Tax Paid | Tax Assessment Tax Assessment Total Assessment is a certain percentage of the fair market value that is determined by local assessors to be the total taxable value of land and additions on the property. | Land | Improvement |
|---|---|---|---|---|
| 2024 | $10,259 | $993,281 | $200,000 | $793,281 |
| 2023 | $13,192 | $993,281 | $200,000 | $793,281 |
| 2022 | $12,319 | $993,281 | $200,000 | $793,281 |
| 2021 | $12,319 | $993,281 | $200,000 | $793,281 |
| 2019 | $12,284 | $921,500 | $200,000 | $721,500 |
| 2018 | $12,284 | $921,500 | $200,000 | $721,500 |
| 2017 | $12,181 | $921,500 | $200,000 | $721,500 |
| 2016 | $11,555 | $921,189 | $200,000 | $721,189 |
| 2015 | $10,543 | $848,800 | $200,000 | $648,800 |
| 2014 | $10,536 | $848,800 | $200,000 | $648,800 |
Source: Public Records
Map
Nearby Homes