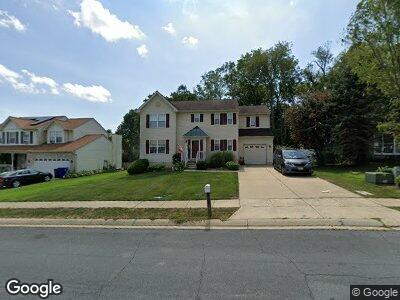
2849 Bynum Overlook Dr Abingdon, MD 21009
Bynum NeighborhoodEstimated Value: $440,000 - $484,000
--
Bed
3
Baths
2,022
Sq Ft
$229/Sq Ft
Est. Value
About This Home
This home is located at 2849 Bynum Overlook Dr, Abingdon, MD 21009 and is currently estimated at $463,426, approximately $229 per square foot. 2849 Bynum Overlook Dr is a home located in Harford County with nearby schools including William S. James Elementary School, Edgewood Middle School, and Edgewood High School.
Ownership History
Date
Name
Owned For
Owner Type
Purchase Details
Closed on
Dec 29, 2009
Sold by
Spencer Russell B
Bought by
Spencer Russell B and Spencer Kathleen L
Current Estimated Value
Home Financials for this Owner
Home Financials are based on the most recent Mortgage that was taken out on this home.
Original Mortgage
$214,000
Interest Rate
4.92%
Mortgage Type
New Conventional
Purchase Details
Closed on
Jun 21, 1999
Sold by
Colletti Lou
Bought by
Spencer Russell B
Purchase Details
Closed on
Jun 12, 1998
Sold by
Spencer Russell B
Bought by
Colletti Lou
Purchase Details
Closed on
Mar 22, 1994
Sold by
Mid Atl Homes Inc
Bought by
Spencer Russell B
Home Financials for this Owner
Home Financials are based on the most recent Mortgage that was taken out on this home.
Original Mortgage
$152,800
Interest Rate
6.9%
Create a Home Valuation Report for This Property
The Home Valuation Report is an in-depth analysis detailing your home's value as well as a comparison with similar homes in the area
Home Values in the Area
Average Home Value in this Area
Purchase History
| Date | Buyer | Sale Price | Title Company |
|---|---|---|---|
| Spencer Russell B | -- | -- | |
| Spencer Russell B | $167,900 | -- | |
| Colletti Lou | $155,000 | -- | |
| Spencer Russell B | $154,000 | -- |
Source: Public Records
Mortgage History
| Date | Status | Borrower | Loan Amount |
|---|---|---|---|
| Open | Spencer Kathleen L | $248,560 | |
| Closed | Spencer Russell B | $252,000 | |
| Closed | Spencer Russell B | $40,000 | |
| Closed | Spencer Kathleen L | $194,950 | |
| Closed | Spencer Russell B | $195,800 | |
| Previous Owner | Spencer Russell B | $214,000 | |
| Previous Owner | Spencer Russell B | $322,460 | |
| Previous Owner | Spencer Russell B | $317,695 | |
| Previous Owner | Spencer Russell B | $281,000 | |
| Previous Owner | Spencer Russell B | $109,000 | |
| Previous Owner | Spencer Russell B | $152,800 | |
| Closed | Colletti Lou | -- |
Source: Public Records
Tax History Compared to Growth
Tax History
| Year | Tax Paid | Tax Assessment Tax Assessment Total Assessment is a certain percentage of the fair market value that is determined by local assessors to be the total taxable value of land and additions on the property. | Land | Improvement |
|---|---|---|---|---|
| 2024 | $3,405 | $316,900 | $0 | $0 |
| 2023 | $3,237 | $297,000 | $100,100 | $196,900 |
| 2022 | $3,105 | $284,933 | $0 | $0 |
| 2021 | $3,010 | $272,867 | $0 | $0 |
| 2020 | $3,010 | $260,800 | $100,100 | $160,700 |
| 2019 | $2,984 | $258,567 | $0 | $0 |
| 2018 | $2,931 | $256,333 | $0 | $0 |
| 2017 | $2,906 | $254,100 | $0 | $0 |
| 2016 | $140 | $249,633 | $0 | $0 |
| 2015 | $3,218 | $245,167 | $0 | $0 |
| 2014 | $3,218 | $240,700 | $0 | $0 |
Source: Public Records
Map
Nearby Homes
- 904 Green Fawn Ct
- 2829 Bynum Overlook Dr
- 3207 Grindle Ct
- 911 Towson Dr
- 800 Pine Creek Way
- 3020 Peverly Run Rd
- 4002 Philadelphia Rd
- 3706 Deer Chase Ct
- 2000 Treese Unit DEVONSHIRE
- 2000 Treese Unit COVINGTON
- 2000 Treese Unit MAGNOLIA
- 2000 Treese Unit SAVANNAH
- 2823 Moorgrass Ct
- 765 Burgh Westra Way
- 2427 Steamboat Way
- 3117 Strasbaugh Dr
- 3230 Pine Crest Ct
- 2502 Chessie Way
- 3143 Strasbaugh Dr
- 1123 Splashing Brook Dr
- 2849 Bynum Overlook Dr
- 2851 Bynum Overlook Dr
- 2847 Bynum Overlook Dr
- 2853 Bynum Overlook Dr
- 2845 Bynum Overlook Dr
- 2838 Bynum Overlook Dr
- 2840 Bynum Overlook Dr
- 2836 Bynum Overlook Dr
- 2843 Bynum Overlook Dr
- 2855 Bynum Overlook Dr
- 2842 Bynum Overlook Dr
- 2834 Bynum Overlook Dr
- 2844 Bynum Overlook Dr
- 2841 Bynum Overlook Dr
- 2857 Bynum Overlook Dr
- 2832 Bynum Overlook Dr
- 0 Hookers Mill Rd Unit HR6575470
- 0 Hookers Mill Rd Unit MDHR244358
- 0 Hookers Mill Rd Unit MDHR180450
- 908 Green Fawn Ct