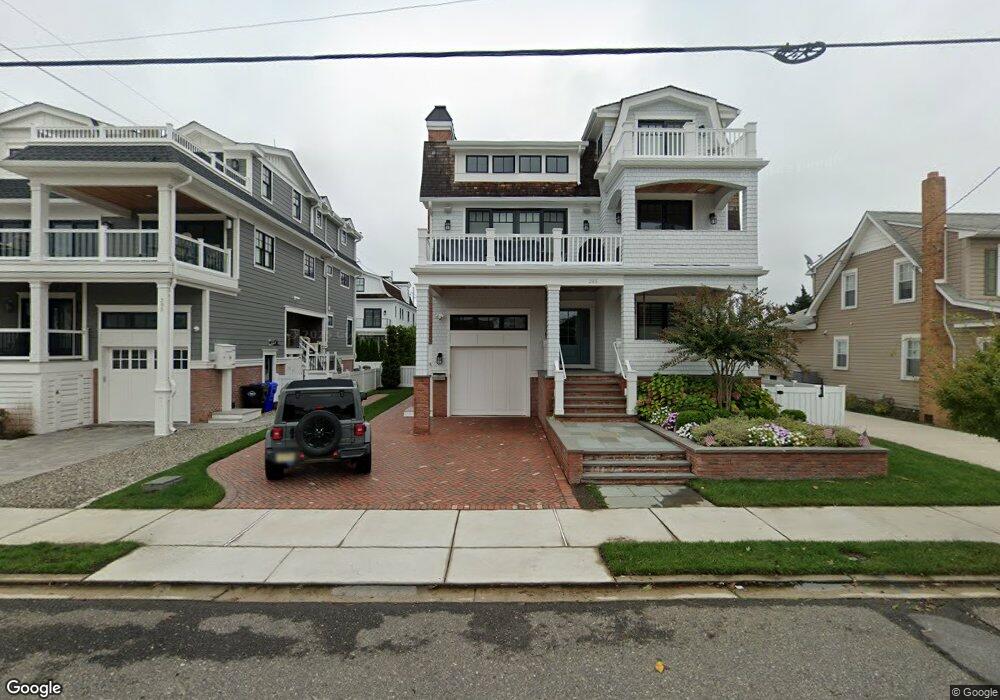
285 37th St Avalon, NJ 08202
Estimated Value: $3,275,000 - $7,254,000
Studio
--
Bath
3,651
Sq Ft
$1,348/Sq Ft
Est. Value
About This Home
This home is located at 285 37th St, Avalon, NJ 08202 and is currently estimated at $4,920,538, approximately $1,347 per square foot. 285 37th St is a home with nearby schools including Avalon Elementary School.
Ownership History
Date
Name
Owned For
Owner Type
Purchase Details
Closed on
Jun 17, 2021
Sold by
Welsh Thomas J
Bought by
Andrews-Bartl Kyle and Flaherty-Bartl Juliann
Current Estimated Value
Home Financials for this Owner
Home Financials are based on the most recent Mortgage that was taken out on this home.
Original Mortgage
$2,160,000
Outstanding Balance
$1,955,611
Interest Rate
2.9%
Mortgage Type
Purchase Money Mortgage
Estimated Equity
$2,964,927
Purchase Details
Closed on
May 24, 2019
Sold by
Aln Corp
Bought by
Welsh Thomas J
Purchase Details
Closed on
May 20, 1993
Sold by
Rising Gemini
Bought by
Aln Corporation
Create a Home Valuation Report for This Property
The Home Valuation Report is an in-depth analysis detailing your home's value as well as a comparison with similar homes in the area
Home Values in the Area
Average Home Value in this Area
Purchase History
| Date | Buyer | Sale Price | Title Company |
|---|---|---|---|
| Andrews-Bartl Kyle | $2,700,000 | None Available | |
| Bartl Kyle Andrews | $2,700,000 | Seaboard Title | |
| Welsh Thomas J | $4,293,000 | Seaboard Title Agency | |
| Aln Corporation | $480,000 | -- | |
| Aln Corporation | $480,000 | -- |
Source: Public Records
Mortgage History
| Date | Status | Borrower | Loan Amount |
|---|---|---|---|
| Open | Bartl Kyle Andrews | $2,160,000 | |
| Closed | Bartl Kyle Andrews | $2,160,000 |
Source: Public Records
Tax History
| Year | Tax Paid | Tax Assessment Tax Assessment Total Assessment is a certain percentage of the fair market value that is determined by local assessors to be the total taxable value of land and additions on the property. | Land | Improvement |
|---|---|---|---|---|
| 2025 | $17,021 | $2,772,100 | $717,500 | $2,054,600 |
| 2024 | $17,021 | $2,772,100 | $717,500 | $2,054,600 |
| 2023 | $16,802 | $2,758,900 | $717,500 | $2,041,400 |
| 2022 | $15,671 | $2,758,900 | $717,500 | $2,041,400 |
| 2021 | $15,163 | $717,500 | $717,500 | $0 |
| 2020 | $10,663 | $2,027,200 | $2,027,200 | $0 |
| 2019 | $11,869 | $2,327,200 | $2,027,200 | $300,000 |
| 2018 | $11,357 | $2,327,200 | $2,027,200 | $300,000 |
| 2017 | $12,163 | $2,187,500 | $1,762,500 | $425,000 |
| 2016 | $12,031 | $2,187,500 | $1,762,500 | $425,000 |
| 2015 | $11,834 | $2,187,500 | $1,762,500 | $425,000 |
| 2014 | $11,703 | $2,187,500 | $1,762,500 | $425,000 |
Source: Public Records
Map
Nearby Homes
- 253 35th St Unit WEST
- 3429 Dune Dr
- 198 40th St
- 162 33rd St
- 173 33rd St Unit 3
- 264 41st St
- 158 32nd St
- 179 32nd St
- 256 42nd St
- 3149 First Ave
- 55 32nd St W Unit C2B
- 55 32nd St W
- 55 32nd St W Unit 1A
- 2934 Ocean Dr Unit North
- 25 32nd St W
- 2928 Ocean Dr Unit C-N
- 2988 1st Ave
- 2968 First Ave
- 2958 Avalon Ave
- 179 27th St
Your Personal Tour Guide
Ask me questions while you tour the home.