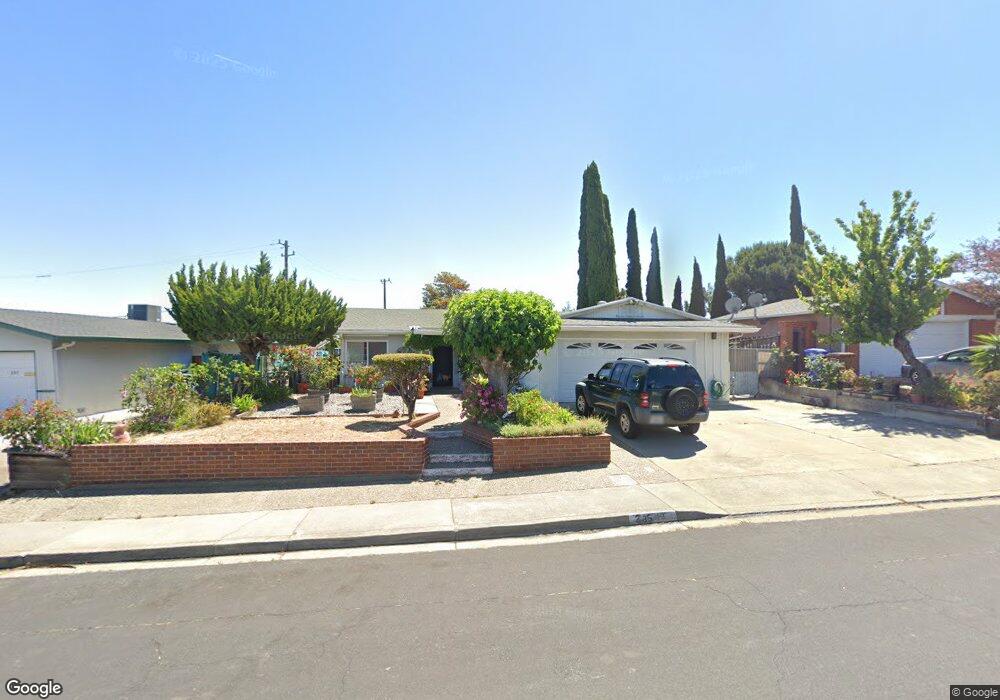
285 Anchor Dr Bay Point, CA 94565
Shore Acres NeighborhoodEstimated Value: $448,000 - $548,000
3
Beds
2
Baths
1,326
Sq Ft
$382/Sq Ft
Est. Value
About This Home
This home is located at 285 Anchor Dr, Bay Point, CA 94565 and is currently estimated at $506,910, approximately $382 per square foot. 285 Anchor Dr is a home located in Contra Costa County with nearby schools including Rio Vista Elementary School, Riverview Middle School, and Mt. Diablo High School.
Ownership History
Date
Name
Owned For
Owner Type
Purchase Details
Closed on
Aug 6, 2024
Sold by
Foltz Lina
Bought by
Foltz 2024 Revocable Trust and Foltz
Current Estimated Value
Purchase Details
Closed on
Jun 16, 2021
Sold by
Isabel Vazquez
Bought by
Ysabel Vazquez Revocable Living Trust
Purchase Details
Closed on
Jun 4, 2021
Sold by
Ysabel Vazquez Revocable Living Trust and Vazquez Mario
Bought by
Vazquez Mario and Orleman Maria
Purchase Details
Closed on
Mar 18, 2011
Sold by
Vazquez Isabel
Bought by
Vazquez Isabel
Create a Home Valuation Report for This Property
The Home Valuation Report is an in-depth analysis detailing your home's value as well as a comparison with similar homes in the area
Home Values in the Area
Average Home Value in this Area
Purchase History
| Date | Buyer | Sale Price | Title Company |
|---|---|---|---|
| Foltz 2024 Revocable Trust | -- | None Listed On Document | |
| Ysabel Vazquez Revocable Living Trust | -- | -- | |
| Vazquez Mario | -- | None Listed On Document | |
| Ysabel Vazquez Revocable Living Trust | -- | -- | |
| Vazquez Isabel | -- | None Available |
Source: Public Records
Tax History
| Year | Tax Paid | Tax Assessment Tax Assessment Total Assessment is a certain percentage of the fair market value that is determined by local assessors to be the total taxable value of land and additions on the property. | Land | Improvement |
|---|---|---|---|---|
| 2025 | $1,581 | $62,452 | $24,480 | $37,972 |
| 2024 | $1,465 | $61,228 | $24,000 | $37,228 |
| 2023 | $1,465 | $60,029 | $23,530 | $36,499 |
| 2022 | $1,460 | $58,853 | $23,069 | $35,784 |
| 2021 | $1,419 | $57,700 | $22,617 | $35,083 |
| 2019 | $1,360 | $55,992 | $21,948 | $34,044 |
| 2018 | $1,320 | $54,895 | $21,518 | $33,377 |
| 2017 | $1,276 | $53,820 | $21,097 | $32,723 |
| 2016 | $1,223 | $52,766 | $20,684 | $32,082 |
| 2015 | $1,196 | $51,975 | $20,374 | $31,601 |
| 2014 | $1,164 | $50,957 | $19,975 | $30,982 |
Source: Public Records
Map
Nearby Homes
- 55 Pacifica Ave Unit 49
- 55 Pacifica Ave Unit 77
- 55 Pacifica Ave Unit 90
- 55 Pacifica Ave Unit 146
- 215 San Bernardino Ct
- 94 Anchor Dr
- 92 Beach Dr
- 87 Bay Dr
- 93 Beach Dr
- 97 Harbor Dr
- 43 Bay Dr
- 621 Bounty Dr
- 39 Canal Dr
- 130 Savona Way
- 3777 Willow Pass Rd Unit 85
- 3777 Willow Pass Rd Unit 20
- 39 Harbor Dr
- 149 Shore Rd
- 3432 Danielle Place
- 232 Shore Rd
Your Personal Tour Guide
Ask me questions while you tour the home.