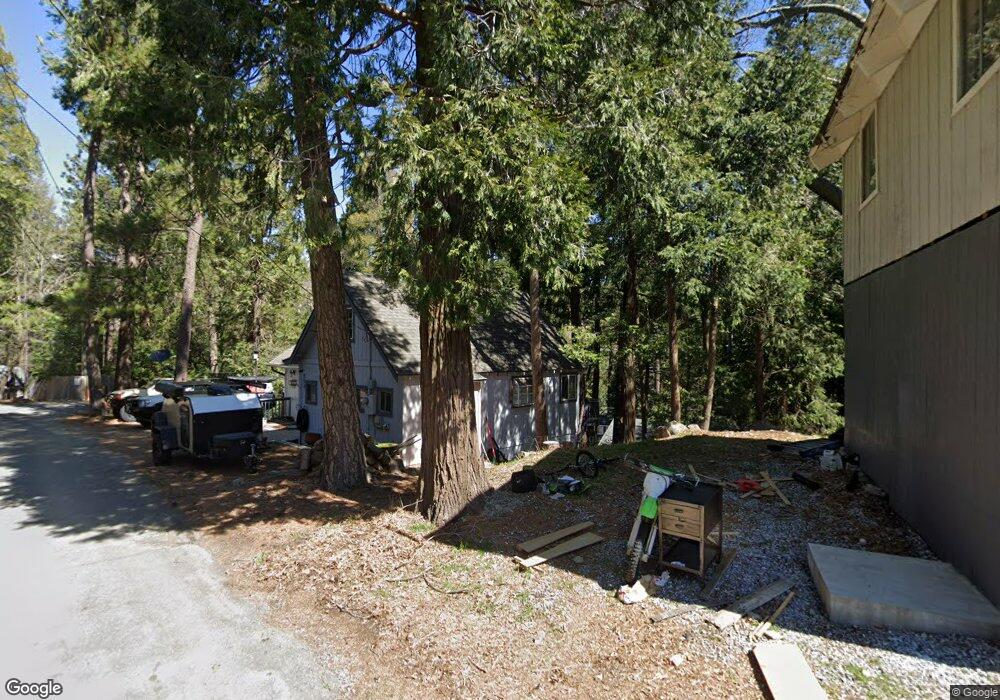
285 Big Deer Rd Cedarpines Park, CA 92322
Estimated Value: $274,970 - $298,000
2
Beds
1
Bath
948
Sq Ft
$304/Sq Ft
Est. Value
About This Home
This home is located at 285 Big Deer Rd, Cedarpines Park, CA 92322 and is currently estimated at $287,743, approximately $303 per square foot. 285 Big Deer Rd is a home with nearby schools including Valley Of Enchantment Elementary School, Mary P. Henck Intermediate School, and Rim Of The World Senior High School.
Ownership History
Date
Name
Owned For
Owner Type
Purchase Details
Closed on
Sep 17, 2021
Sold by
Crouch Karen and The Croch Family Trust
Bought by
Berglund Paul G
Current Estimated Value
Home Financials for this Owner
Home Financials are based on the most recent Mortgage that was taken out on this home.
Original Mortgage
$175,000
Outstanding Balance
$159,237
Interest Rate
2.8%
Mortgage Type
New Conventional
Estimated Equity
$128,506
Purchase Details
Closed on
Aug 20, 2014
Sold by
Crouch Karen Jo
Bought by
Crouch Karen and Crouch Family Trust
Purchase Details
Closed on
Jan 25, 2011
Sold by
Crouch Karen Jo and Crouch Malcom L
Bought by
Crouch Karen Jo and Crouch Malcom L
Home Financials for this Owner
Home Financials are based on the most recent Mortgage that was taken out on this home.
Original Mortgage
$53,200
Interest Rate
4.84%
Mortgage Type
New Conventional
Purchase Details
Closed on
Mar 30, 1999
Sold by
Ruston Karen Jo
Bought by
Mcdonald Paul E and Mcdonald Karen Jo
Create a Home Valuation Report for This Property
The Home Valuation Report is an in-depth analysis detailing your home's value as well as a comparison with similar homes in the area
Home Values in the Area
Average Home Value in this Area
Purchase History
| Date | Buyer | Sale Price | Title Company |
|---|---|---|---|
| Berglund Paul G | $275,000 | Stewart Title Of Ca Inc | |
| Crouch Karen | -- | None Available | |
| Crouch Karen Jo | -- | Servicelink | |
| Mcdonald Paul E | -- | -- |
Source: Public Records
Mortgage History
| Date | Status | Borrower | Loan Amount |
|---|---|---|---|
| Open | Berglund Paul G | $175,000 | |
| Previous Owner | Crouch Karen Jo | $53,200 |
Source: Public Records
Tax History
| Year | Tax Paid | Tax Assessment Tax Assessment Total Assessment is a certain percentage of the fair market value that is determined by local assessors to be the total taxable value of land and additions on the property. | Land | Improvement |
|---|---|---|---|---|
| 2025 | $3,772 | $286,526 | $31,836 | $254,690 |
| 2024 | $3,639 | $280,908 | $31,212 | $249,696 |
| 2023 | $3,594 | $275,400 | $30,600 | $244,800 |
| 2022 | $1,199 | $270,000 | $30,000 | $240,000 |
| 2021 | $1,184 | $71,476 | $2,939 | $68,537 |
| 2020 | $1,179 | $70,743 | $2,909 | $67,834 |
| 2019 | $1,157 | $69,356 | $2,852 | $66,504 |
| 2018 | $989 | $67,996 | $2,796 | $65,200 |
| 2017 | $974 | $66,663 | $2,741 | $63,922 |
| 2016 | $949 | $65,356 | $2,687 | $62,669 |
| 2015 | $940 | $64,375 | $2,647 | $61,728 |
| 2014 | $927 | $63,114 | $2,595 | $60,519 |
Source: Public Records
Map
Nearby Homes
- 319 Triangle Nook Rd
- 0 Fir St Unit IG25176070
- 0 Lovers Ln Unit IG25181916
- 0 Lovers Ln Unit 32502072
- 40 Fir St
- 1 Long Beach Ave
- 21801 Plunge Rd
- 0 Running Springs Ln
- 21854 Whispering Pines Dr
- 22052 Crest Forest Dr
- 756 Mojave River (Near) Rd
- 21510 Crest Forest Dr
- 0 Elliot Rd Unit IG24080271
- 21962 Elliot Rd
- 0 Pine Dr Unit OC24064068
- 19 Tower Heights Rd
- 783 Tower Heights Rd
- 1 Tower Heights Rd
- 21858 Fern Canyon Rd
- 22253 Pine Dr
- 11 Buck
- 11 Deer Run
- 11 Burnt Mill Canyon Road Area
- 11 Deer Run Road Area
- 21929 Crest Forest Dr
- 21931 Crest Forest Dr
- 299 Big Deer Rd
- 302 Big Deer Rd
- 258 Big Deer Rd
- 301 Big Deer Rd
- 21925 Crest Forest Dr
- 295 Big Deer Rd
- 21935 Crest Forest Dr
- 0 Triangle Nook Rd Unit E10099179
- 0 N Triangle Nook Rd Unit AR14024131
- 0 Triangle Nook Rd Unit EV14176613
- 0 Triangle Nook Rd Unit EV14176570
- 0 Nook Rd Unit AR15127346
- 0 Triangle Nook Rd Unit RW2141576
- 0 Triangle Nook Rd Unit RW2141575
Your Personal Tour Guide
Ask me questions while you tour the home.