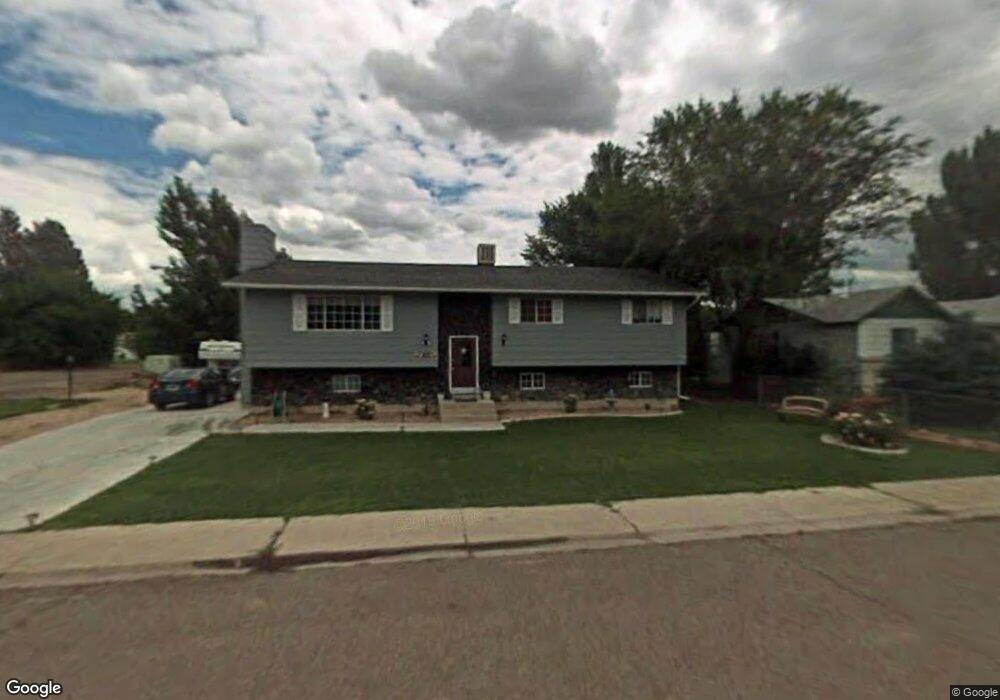
285 Cobble St Salina, UT 84654
Estimated Value: $334,000 - $370,000
5
Beds
2
Baths
2,488
Sq Ft
$140/Sq Ft
Est. Value
About This Home
This home is located at 285 Cobble St, Salina, UT 84654 and is currently estimated at $348,244, approximately $139 per square foot. 285 Cobble St is a home located in Sevier County with nearby schools including Salina School, North Sevier Middle School, and North Sevier High School.
Ownership History
Date
Name
Owned For
Owner Type
Purchase Details
Closed on
May 8, 2023
Sold by
Parsons Greg
Bought by
Foster Joseph Guy
Current Estimated Value
Home Financials for this Owner
Home Financials are based on the most recent Mortgage that was taken out on this home.
Original Mortgage
$248,000
Outstanding Balance
$241,016
Interest Rate
6.32%
Mortgage Type
New Conventional
Estimated Equity
$107,228
Purchase Details
Closed on
Oct 26, 2015
Sold by
Burgess Benjermine Lee and Burgess Kylie R
Bought by
Parsons Greg and Parsons Heather
Home Financials for this Owner
Home Financials are based on the most recent Mortgage that was taken out on this home.
Original Mortgage
$126,000
Interest Rate
3.87%
Mortgage Type
New Conventional
Purchase Details
Closed on
Oct 4, 2010
Sold by
Wilson Shawn J
Bought by
Wilson Holly A
Home Financials for this Owner
Home Financials are based on the most recent Mortgage that was taken out on this home.
Original Mortgage
$133,000
Interest Rate
4.28%
Mortgage Type
USDA
Create a Home Valuation Report for This Property
The Home Valuation Report is an in-depth analysis detailing your home's value as well as a comparison with similar homes in the area
Home Values in the Area
Average Home Value in this Area
Purchase History
| Date | Buyer | Sale Price | Title Company |
|---|---|---|---|
| Foster Joseph Guy | -- | First American Title | |
| Parsons Greg | -- | First American Title Insuran | |
| Wilson Holly A | -- | -- | |
| Burgess Benjermine Lee | -- | -- |
Source: Public Records
Mortgage History
| Date | Status | Borrower | Loan Amount |
|---|---|---|---|
| Open | Foster Joseph Guy | $248,000 | |
| Previous Owner | Parsons Greg | $126,000 | |
| Previous Owner | Burgess Benjermine Lee | $133,000 |
Source: Public Records
Tax History Compared to Growth
Tax History
| Year | Tax Paid | Tax Assessment Tax Assessment Total Assessment is a certain percentage of the fair market value that is determined by local assessors to be the total taxable value of land and additions on the property. | Land | Improvement |
|---|---|---|---|---|
| 2024 | $1,570 | $155,041 | $17,756 | $137,285 |
| 2023 | $1,667 | $169,164 | $22,584 | $146,580 |
| 2022 | $1,618 | $132,970 | $14,861 | $118,109 |
| 2021 | $1,476 | $101,164 | $16,170 | $84,994 |
| 2020 | $1,297 | $83,138 | $16,170 | $66,968 |
| 2019 | $1,009 | $67,690 | $14,440 | $53,250 |
| 2018 | $933 | $61,580 | $13,750 | $47,830 |
| 2017 | $929 | $58,320 | $13,750 | $44,570 |
| 2016 | $742 | $54,700 | $0 | $0 |
| 2015 | $742 | $54,700 | $0 | $0 |
| 2014 | $742 | $51,950 | $0 | $0 |
Source: Public Records
Map
Nearby Homes
- 325 Cobble St
- 375 W Sandy Ln
- 12 E 200 S
- 89 N 200 W
- 50 W 100 N
- 321 S 200 E
- 268 N Salina Creek Dr
- 630 W 285 N
- 1200 Old Highway 10
- Tbd S State St Unit LotWP001
- 1200 E Old Highway 10
- 0 W 500 S
- 225 S 300 W
- 240 S State St
- 205 W 200 S
- 206 W 580 N Unit 5
- 70 N Main
- 390 N 300 W
- 770 N 300 W Unit 102
- 675 N 300 W Unit 111
- 395 Sandy Ln
- 306 Cobble St
- 315 Cobble St
- 284 S Daffey Dr
- 286 Cobble St
- 400 Sandy Ln
- 314 S Daffey Dr
- 265 Brooklyn Dr
- 316 Cobble St
- 305 Cobble St
- 256 Brooklyn Dr
- 264 S Meadowbrook Dr
- 324 S Daffey Dr
- 326 Cobble St
- 175 Sandy Ln
- 485 Meadow Brook Dr
- 287 S Daffey Dr
- 245 Brooklyn Dr
- 301 S Daffey Dr
- 311 S Daffey Dr