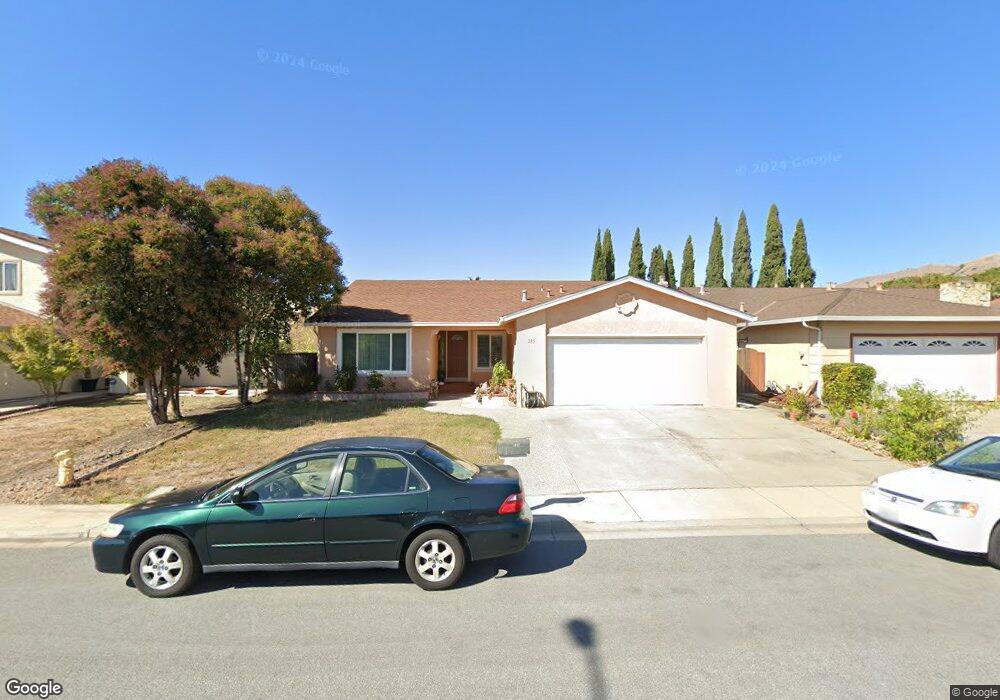
285 Enriquez Ct Milpitas, CA 95035
Milpitas AreaEstimated Value: $1,560,000 - $2,097,000
About This Home
This home is located at 285 Enriquez Ct, Milpitas, CA 95035 and is currently estimated at $1,763,467, approximately $1,034 per square foot. 285 Enriquez Ct is a home located in Santa Clara County with nearby schools including Curtner Elementary School, Thomas Russell Middle School, and Milpitas High School.
Ownership History
We collect this data history from publicly available records. To have your information removed, we recommend requesting removal directly through your county’s website.
Purchase Details
Home Financials for this Owner
Home Financials are based on the most recent Mortgage that was taken out on this home.Home Values in the Area
Average Home Value in this Area
Purchase History
We collect this data history from publicly available records. To have your information removed, we recommend requesting removal directly through your county’s website.
| Date | Buyer | Sale Price | Title Company |
|---|---|---|---|
| $150,500 | First American Title Company |
Mortgage History
We collect this data history from publicly available records. To have your information removed, we recommend requesting removal directly through your county’s website.
| Date | Status | Borrower | Loan Amount |
|---|---|---|---|
| Closed | $200,000 | ||
| Closed | $75,000 |
Tax History
We collect this data history from publicly available records. To have your information removed, we recommend requesting removal directly through your county’s website.
| Year | Tax Paid | Tax Assessment Tax Assessment Total Assessment is a certain percentage of the fair market value that is determined by local assessors to be the total taxable value of land and additions on the property. | Land | Improvement |
|---|---|---|---|---|
| 2026 | $3,731 | $321,062 | $117,788 | $203,274 |
| 2025 | $3,553 | $300,062 | $115,479 | $184,583 |
| 2024 | $3,553 | $294,179 | $113,215 | $180,964 |
| 2023 | $3,540 | $288,412 | $110,996 | $177,416 |
| 2022 | $3,527 | $282,758 | $108,820 | $173,938 |
| 2021 | $3,475 | $277,215 | $106,687 | $170,528 |
| 2020 | $3,414 | $274,374 | $105,594 | $168,780 |
| 2019 | $3,377 | $268,995 | $103,524 | $165,471 |
| 2018 | $3,213 | $263,722 | $101,495 | $162,227 |
| 2017 | $3,171 | $258,552 | $99,505 | $159,047 |
| 2016 | $3,039 | $253,483 | $97,554 | $155,929 |
| 2015 | $3,008 | $249,676 | $96,089 | $153,587 |
| 2014 | $2,915 | $244,786 | $94,207 | $150,579 |
Map
- 931 Hamilton Ave
- 911 Erie Cir
- 1101 Clifford Ln
- 292 Silverlake Ct
- 526 Arbor Way
- 895 Del Vaile Ct
- 62 Washington Square Dr
- 180 Marylinn Dr Unit C26
- 7280 Marylinn Dr
- 242 Fairmeadow Way
- 73 Images Cir
- 1009 Nicklaus Ave
- 1515 N Milpitas Blvd Unit 17
- 101 Sunnyhills Ct
- 352 Montecito Way
- 0 Railroad Ave
- 1464 Los Buellis Way
- 637 Penitencia St
- 469 Desert Holly St
- 406 Terra Mesa Way
- 295 Enriquez Ct
- 275 Enriquez Ct
- 288 Merz Ct
- 305 Enriquez Ct
- 265 Enriquez Ct
- 278 Merz Ct
- 298 Merz Ct
- 290 Enriquez Ct
- 308 Merz Ct
- 268 Merz Ct
- 280 Enriquez Ct
- 315 Enriquez Ct
- 300 Enriquez Ct
- 270 Enriquez Ct
- 318 Merz Ct
- 310 Enriquez Ct
- 868 Hamilton Ave
- 871 Strickroth Dr
- 899 Hamilton Ave
- 907 Hamilton Ave
Ask me questions while you tour the home.