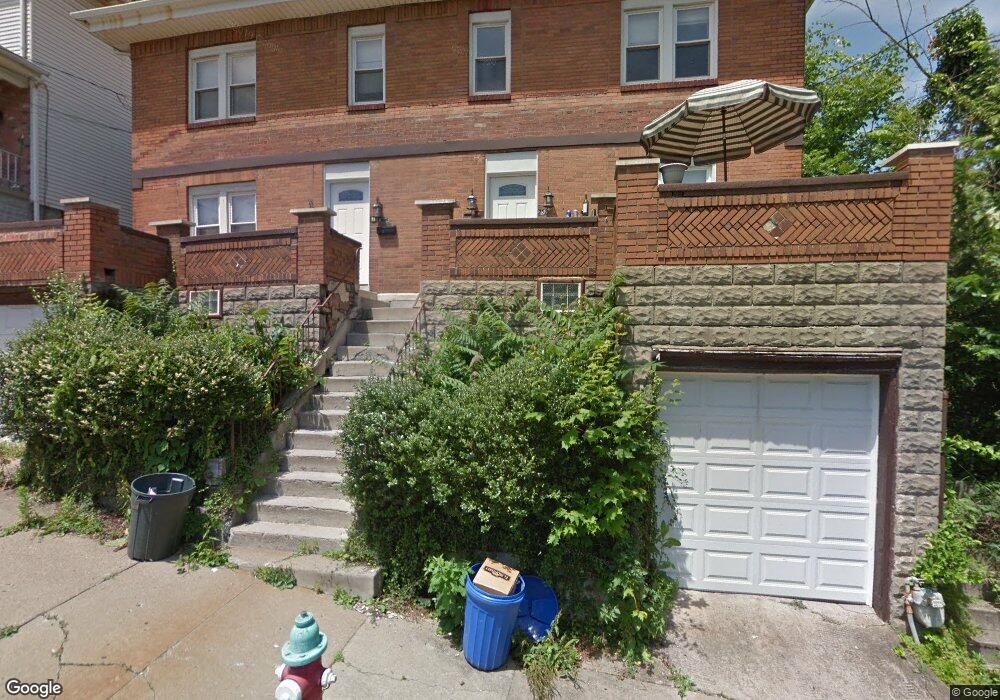
285 Lelia St Pittsburgh, PA 15211
Mount Washington NeighborhoodEstimated Value: $254,835 - $289,000
2
Beds
1
Bath
3,080
Sq Ft
$87/Sq Ft
Est. Value
About This Home
This home is located at 285 Lelia St, Pittsburgh, PA 15211 and is currently estimated at $267,959, approximately $86 per square foot. 285 Lelia St is a home located in Allegheny County with nearby schools including Pittsburgh Whittier K-5, South Hills Middle School, and Pittsburgh Brashear High School.
Ownership History
Date
Name
Owned For
Owner Type
Purchase Details
Closed on
Sep 5, 2023
Sold by
Alnajjar Ammar Trste and Lelia St Trust No 285 287
Bought by
Schneider William
Current Estimated Value
Purchase Details
Closed on
Aug 31, 2023
Sold by
Lelia St Trust No 285 287
Bought by
Schneider William
Purchase Details
Closed on
Aug 24, 2001
Sold by
Federal National Mortgage Association
Bought by
Washington Mutual Home Loans Inc and Pnc Mtg Corp Of America
Purchase Details
Closed on
May 9, 2001
Sold by
Mohr Michael Allen
Bought by
Federal National Mortgage Association
Create a Home Valuation Report for This Property
The Home Valuation Report is an in-depth analysis detailing your home's value as well as a comparison with similar homes in the area
Home Values in the Area
Average Home Value in this Area
Purchase History
| Date | Buyer | Sale Price | Title Company |
|---|---|---|---|
| Schneider William | $240,000 | -- | |
| Schneider William | $240,000 | -- | |
| Schneider William | $240,000 | -- | |
| Washington Mutual Home Loans Inc | $104,700 | -- | |
| Federal National Mortgage Association | $1,416 | -- |
Source: Public Records
Tax History Compared to Growth
Tax History
| Year | Tax Paid | Tax Assessment Tax Assessment Total Assessment is a certain percentage of the fair market value that is determined by local assessors to be the total taxable value of land and additions on the property. | Land | Improvement |
|---|---|---|---|---|
| 2025 | $1,728 | $75,000 | $18,000 | $57,000 |
| 2024 | $1,728 | $75,000 | $18,000 | $57,000 |
| 2023 | $1,728 | $75,000 | $18,000 | $57,000 |
| 2022 | $1,706 | $75,000 | $18,000 | $57,000 |
| 2021 | $1,724 | $75,000 | $18,000 | $57,000 |
| 2020 | $1,697 | $75,000 | $18,000 | $57,000 |
| 2019 | $1,697 | $75,000 | $18,000 | $57,000 |
| 2018 | $1,361 | $75,000 | $18,000 | $57,000 |
| 2017 | $1,697 | $75,000 | $18,000 | $57,000 |
| 2016 | $355 | $75,000 | $18,000 | $57,000 |
| 2015 | $355 | $75,000 | $18,000 | $57,000 |
| 2014 | $1,660 | $75,000 | $18,000 | $57,000 |
Source: Public Records
Map
Nearby Homes