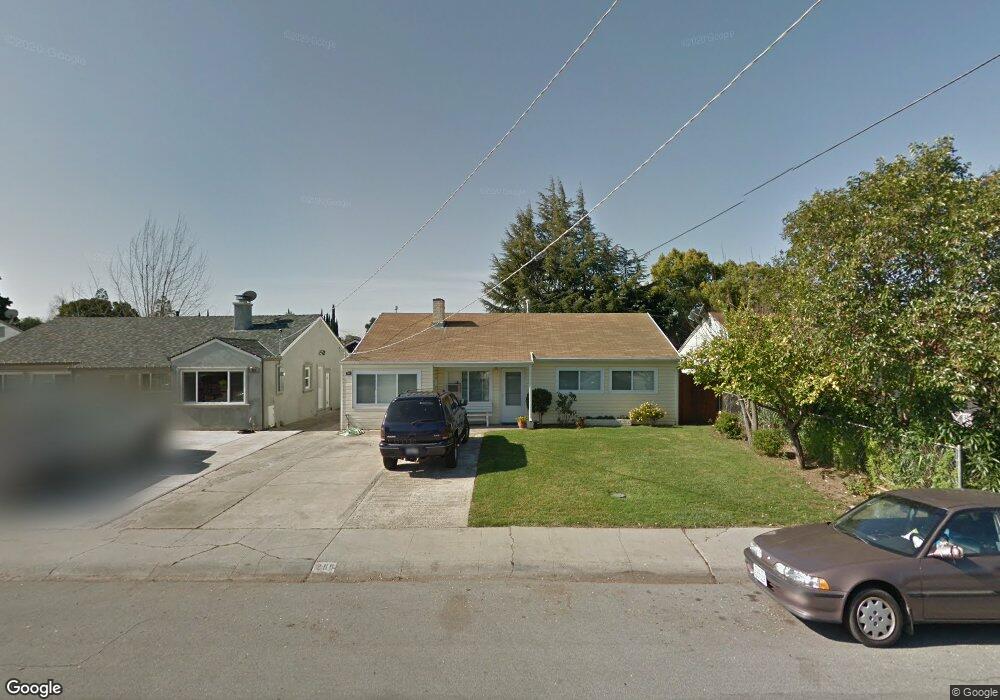
285 N Cragmont Ave San Jose, CA 95127
Alum Rock NeighborhoodEstimated Value: $849,000 - $1,185,000
3
Beds
2
Baths
1,100
Sq Ft
$945/Sq Ft
Est. Value
About This Home
This home is located at 285 N Cragmont Ave, San Jose, CA 95127 and is currently estimated at $1,039,934, approximately $945 per square foot. 285 N Cragmont Ave is a home located in Santa Clara County with nearby schools including Linda Vista Elementary School, Joseph George Middle School, and James Lick High School.
Ownership History
Date
Name
Owned For
Owner Type
Purchase Details
Closed on
Dec 5, 2012
Sold by
Lan Gang
Bought by
Lan Gang and Shan Yanjing
Current Estimated Value
Purchase Details
Closed on
Oct 1, 2012
Sold by
Bella Aranzazu
Bought by
Lan Gang
Home Financials for this Owner
Home Financials are based on the most recent Mortgage that was taken out on this home.
Original Mortgage
$243,000
Outstanding Balance
$168,824
Interest Rate
3.58%
Mortgage Type
New Conventional
Estimated Equity
$871,110
Purchase Details
Closed on
Apr 19, 2006
Sold by
Bella Benjamin Simmons and Bella Aranzazu Sanz
Bought by
Bella Benjamin and Bella Aranzazu
Home Financials for this Owner
Home Financials are based on the most recent Mortgage that was taken out on this home.
Original Mortgage
$400,000
Interest Rate
1%
Mortgage Type
Negative Amortization
Create a Home Valuation Report for This Property
The Home Valuation Report is an in-depth analysis detailing your home's value as well as a comparison with similar homes in the area
Home Values in the Area
Average Home Value in this Area
Purchase History
| Date | Buyer | Sale Price | Title Company |
|---|---|---|---|
| Lan Gang | -- | None Available | |
| Lan Gang | $325,000 | Chicago Title Company | |
| Lan Gang | -- | Chicago Title Company | |
| Bella Benjamin | -- | Alliance Title Company |
Source: Public Records
Mortgage History
| Date | Status | Borrower | Loan Amount |
|---|---|---|---|
| Open | Lan Gang | $243,000 | |
| Previous Owner | Bella Benjamin | $400,000 |
Source: Public Records
Tax History Compared to Growth
Tax History
| Year | Tax Paid | Tax Assessment Tax Assessment Total Assessment is a certain percentage of the fair market value that is determined by local assessors to be the total taxable value of land and additions on the property. | Land | Improvement |
|---|---|---|---|---|
| 2025 | $6,233 | $400,202 | $258,594 | $141,608 |
| 2024 | $6,233 | $392,356 | $253,524 | $138,832 |
| 2023 | $6,086 | $384,663 | $248,553 | $136,110 |
| 2022 | $5,916 | $377,122 | $243,680 | $133,442 |
| 2021 | $5,711 | $369,728 | $238,902 | $130,826 |
| 2020 | $5,611 | $365,938 | $236,453 | $129,485 |
| 2019 | $5,478 | $358,764 | $231,817 | $126,947 |
| 2018 | $5,447 | $351,730 | $227,272 | $124,458 |
| 2017 | $5,476 | $344,834 | $222,816 | $122,018 |
| 2016 | $5,184 | $338,074 | $218,448 | $119,626 |
| 2015 | $5,191 | $332,997 | $215,167 | $117,830 |
| 2014 | $5,052 | $326,475 | $210,953 | $115,522 |
Source: Public Records
Map
Nearby Homes
- 292 N Cragmont Ave
- 3278 Faith Ct
- 207 N Claremont Ave
- 3101 Starburst Ct
- 274 Vista Ave
- 0 Gordon Blvd Unit FR25034343
- 0 Gordon Blvd Unit 625465
- 0 Gordon Blvd Unit 231524
- 0 Gordon Blvd Unit SR23111317
- 160 Talmadge Ave
- 186 Mountain View Ave
- 80 Pickford Ave
- 636 Gridley St
- 550 Toyon Ave Unit 8
- 58 Clareview Ave
- 75 S Cragmont Ave
- 124 Cedar Ln
- 14830 Corralitos Ln
- 3482 Golf Dr
- 0000 Altadena Ln
- 287 N Cragmont Ave
- 283 N Cragmont Ave
- 289 N Cragmont Ave
- 3617 Keswick Ct
- 281 N Cragmont Ave
- 3624 Keswick Ct
- 3616 Kenyon Ct
- 291 N Cragmont Ave
- 277 N Cragmont Ave
- 284 N Cragmont Ave
- 286 N Cragmont Ave
- 282 N Cragmont Ave
- 3609 Keswick Ct
- 3616 Keswick Ct Unit 2
- 280 N Cragmont Ave
- 288 N Cragmont Ave
- 3624 Kenyon Ct
- 3608 Kenyon Ct
- 293 N Cragmont Ave
- 273 N Cragmont Ave