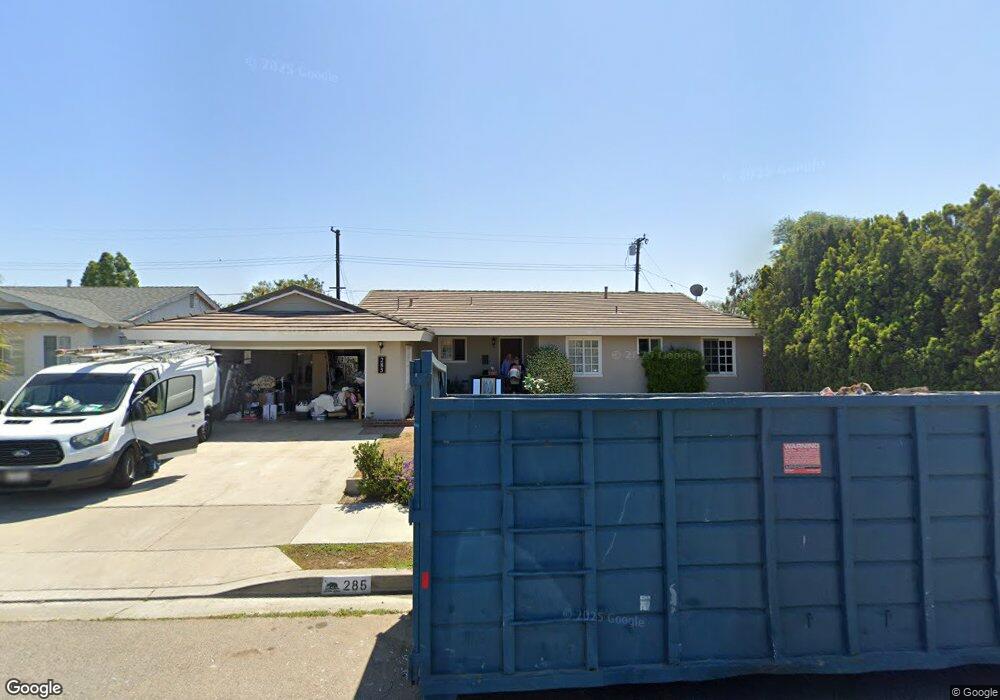
285 S Shasta St Orange, CA 92869
Estimated Value: $1,007,000 - $1,178,000
5
Beds
3
Baths
2,011
Sq Ft
$532/Sq Ft
Est. Value
About This Home
This home is located at 285 S Shasta St, Orange, CA 92869 and is currently estimated at $1,070,318, approximately $532 per square foot. 285 S Shasta St is a home located in Orange County with nearby schools including La Veta Elementary School, El Modena High School, and Spirit Christian Academy.
Ownership History
Date
Name
Owned For
Owner Type
Purchase Details
Closed on
Mar 7, 2025
Sold by
Cvr 285 Shasta St Llc
Bought by
Chiapuzio James
Current Estimated Value
Home Financials for this Owner
Home Financials are based on the most recent Mortgage that was taken out on this home.
Original Mortgage
$650,000
Outstanding Balance
$646,660
Interest Rate
6.85%
Mortgage Type
New Conventional
Estimated Equity
$423,658
Purchase Details
Closed on
Dec 12, 2013
Sold by
Chiapuzio Debra Jo
Bought by
Chiapuzio James A
Purchase Details
Closed on
Mar 7, 2005
Sold by
Vanriper Marianne
Bought by
Vanriper Marianne and Anton Chiapuzio Irrevocable Trust
Purchase Details
Closed on
May 24, 1994
Sold by
Anton Chiapuzio and Anton Sue Chiapuzio
Bought by
Chiapuzio Anton and Chiapuzio Sue
Create a Home Valuation Report for This Property
The Home Valuation Report is an in-depth analysis detailing your home's value as well as a comparison with similar homes in the area
Home Values in the Area
Average Home Value in this Area
Purchase History
| Date | Buyer | Sale Price | Title Company |
|---|---|---|---|
| Chiapuzio James | $1,000,000 | Ticor Title | |
| Chiapuzio James A | -- | None Available | |
| Chiapuzio Anton M | -- | None Available | |
| Chiapuzio Ronald L | -- | None Available | |
| Vanriper Marianne | -- | None Available | |
| Cvr 285 Shasta St Llc | -- | None Available | |
| Vanriper Marianne | -- | None Available | |
| Vanriper Marianne | -- | -- | |
| Chiapuzio Anton | -- | -- | |
| Chiapuzio Anton | -- | -- |
Source: Public Records
Mortgage History
| Date | Status | Borrower | Loan Amount |
|---|---|---|---|
| Open | Chiapuzio James | $650,000 |
Source: Public Records
Tax History Compared to Growth
Tax History
| Year | Tax Paid | Tax Assessment Tax Assessment Total Assessment is a certain percentage of the fair market value that is determined by local assessors to be the total taxable value of land and additions on the property. | Land | Improvement |
|---|---|---|---|---|
| 2025 | $1,785 | $134,419 | $43,205 | $91,214 |
| 2024 | $1,785 | $131,784 | $42,358 | $89,426 |
| 2023 | $1,742 | $129,200 | $41,527 | $87,673 |
| 2022 | $1,705 | $126,667 | $40,713 | $85,954 |
| 2021 | $1,662 | $124,184 | $39,915 | $84,269 |
| 2020 | $1,647 | $122,911 | $39,506 | $83,405 |
| 2019 | $1,629 | $120,501 | $38,731 | $81,770 |
| 2018 | $1,606 | $118,139 | $37,972 | $80,167 |
| 2017 | $1,547 | $115,823 | $37,227 | $78,596 |
| 2016 | $1,519 | $113,552 | $36,497 | $77,055 |
| 2015 | $1,497 | $111,847 | $35,949 | $75,898 |
| 2014 | $1,465 | $109,657 | $35,245 | $74,412 |
Source: Public Records
Map
Nearby Homes
- 285 S James St
- 129 S Kathleen Ln
- 308 S Craig Dr
- 310 N Swidler St
- 448 N Londonderry Ln Unit D
- 3801 E Spring St
- 3932 E Sycamore Ave
- 3145 E Scotts View Unit A
- 3315 E Romelle Ave
- 3318 E Chardonnay Ln Unit B
- 12931 Prospect Ave
- 552 S Yorba St
- 411 S Hewes St
- 3527 E Barrington Dr
- 672 S Schug St
- 234 N Milford St
- 4705 E Washington Ave
- 429 S Hill St
- 12302 Circula Panorama
- 18936 1/2 E Smiley Dr
- 295 S Shasta St
- 273 S Shasta St
- 284 S Dunas St
- 294 S Dunas St
- 272 S Dunas St
- 284 S Shasta St
- 294 S Shasta St
- 272 S Shasta St
- 258 S Dunas St
- 260 S Shasta St
- 258 S Shasta St
- 248 S Dunas St
- 285 S Dunas St
- 273 S Dunas St
- 295 S Dunas St
- 248 S Shasta St
- 285 S Prospect St
- 295 S Prospect St
- 273 S Prospect St