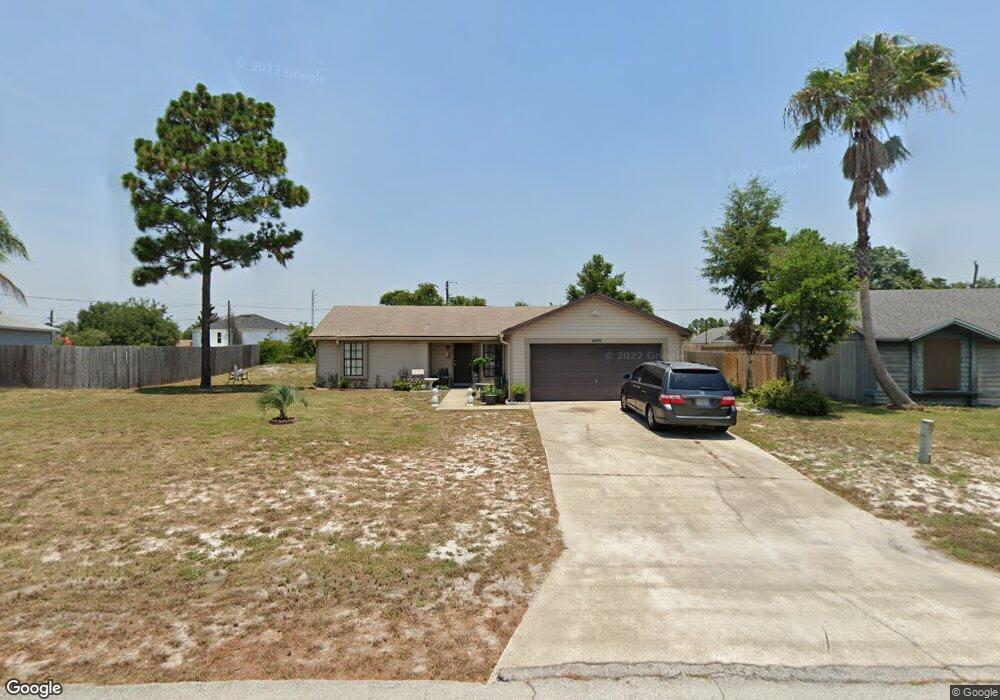
2850 Bedford St Deltona, FL 32738
Estimated Value: $256,300 - $290,000
3
Beds
2
Baths
1,248
Sq Ft
$219/Sq Ft
Est. Value
About This Home
This home is located at 2850 Bedford St, Deltona, FL 32738 and is currently estimated at $273,325, approximately $219 per square foot. 2850 Bedford St is a home located in Volusia County with nearby schools including Volusia Pines Elementary School, Galaxy Middle School, and Deltona High School.
Ownership History
Date
Name
Owned For
Owner Type
Purchase Details
Closed on
Apr 3, 2015
Sold by
Cox Randall I and Catherine Cox M
Bought by
Cox Family Trust
Current Estimated Value
Purchase Details
Closed on
Oct 8, 1996
Sold by
Bradford Daphne
Bought by
Cox Randall I and Cox Catherne M
Purchase Details
Closed on
Nov 10, 1993
Sold by
Secretary Veterans Affairs
Bought by
Bradford Daphne
Home Financials for this Owner
Home Financials are based on the most recent Mortgage that was taken out on this home.
Original Mortgage
$71,000
Interest Rate
6.75%
Purchase Details
Closed on
Aug 6, 1993
Sold by
Clerk Circuit Court
Bought by
Ryland Mtg Co
Purchase Details
Closed on
Nov 15, 1987
Bought by
Cox Randall I Tr
Purchase Details
Closed on
Jun 15, 1987
Bought by
Cox Randall I Tr
Purchase Details
Closed on
Feb 15, 1987
Bought by
Cox Randall I Tr
Create a Home Valuation Report for This Property
The Home Valuation Report is an in-depth analysis detailing your home's value as well as a comparison with similar homes in the area
Home Values in the Area
Average Home Value in this Area
Purchase History
| Date | Buyer | Sale Price | Title Company |
|---|---|---|---|
| Cox Family Trust | -- | None Available | |
| Cox Family Trust | -- | None Available | |
| Cox Randall I | $103,500 | -- | |
| Bradford Daphne | $71,600 | -- | |
| Ryland Mtg Co | -- | -- | |
| Cox Randall I Tr | $48,100 | -- | |
| Cox Randall I Tr | $13,000 | -- | |
| Cox Randall I Tr | $5,500 | -- |
Source: Public Records
Mortgage History
| Date | Status | Borrower | Loan Amount |
|---|---|---|---|
| Previous Owner | Bradford Daphne | $71,000 |
Source: Public Records
Tax History Compared to Growth
Tax History
| Year | Tax Paid | Tax Assessment Tax Assessment Total Assessment is a certain percentage of the fair market value that is determined by local assessors to be the total taxable value of land and additions on the property. | Land | Improvement |
|---|---|---|---|---|
| 2025 | $3,274 | $201,187 | $46,451 | $154,736 |
| 2024 | $3,274 | $203,906 | $46,451 | $157,455 |
| 2023 | $3,274 | $197,689 | $52,871 | $144,818 |
| 2022 | $3,030 | $171,436 | $37,765 | $133,671 |
| 2021 | $2,845 | $136,525 | $27,946 | $108,579 |
| 2020 | $2,641 | $126,653 | $15,861 | $110,792 |
| 2019 | $2,521 | $114,772 | $12,840 | $101,932 |
| 2018 | $2,342 | $102,374 | $10,045 | $92,329 |
| 2017 | $2,174 | $89,539 | $7,953 | $81,586 |
| 2016 | $1,928 | $73,271 | $0 | $0 |
| 2015 | $1,812 | $65,070 | $0 | $0 |
| 2014 | $1,657 | $58,058 | $0 | $0 |
Source: Public Records
Map
Nearby Homes
- 2930 Grayton St
- 2911 Irondale St
- 2798 Beckwith St
- 2900 Flynn St
- 2753 Beckwith St
- 2745 Beckwith St
- 2831 Fifer Dr
- 2507 Coachman Dr
- 2513 Coachman Dr
- 2519 Coachman Dr
- 2728 Irondale St
- 2775 Apaloosa Trail
- 2624 Beckwith St
- 3339 Croton Ave
- 2645 Coachman Dr
- 3750 Comanche Trail
- 2600 Beckwith St
- 2626 Coachman Dr
- 2609 Coachman Dr
- 3166 Canby Dr
- 2840 Bedford St
- 2860 Bedford St
- 2851 Chalmer St
- 2847 Chalmer St
- 2861 Chalmer St
- 2870 Bedford St
- 2830 Bedford St
- 2841 Chalmer St
- 2857 Bedford St
- 2841 Bedford St
- 2871 Bedford St
- 3463 Commerce Ave
- 2831 Chalmer St
- 2880 Bedford St
- 2831 Bedford St
- 3431 Commerce Ave
- 3441 Commerce Ave
- 2881 Chalmer St
- 2881 Bedford St
- 2850 Chalmer St